Nutanix Resiliency – Part 1 – Node failure rebuild performance

Having worked at Nutanix since mid 2013 with a focus on business critical applications, scalability, resiliency and performance, I’m frequently having conversations with customers and partners around resiliency and how best to configure the Nutanix platform.

One of the many strengths of the Nutanix platform, and an area I spend a lot of my time and energy is it’s resiliency and data integrity and it’s important to understand failure scenarios and how a platform deals with them.

Nutanix uses it’s own distributed storage fabric (ADSF) to provide storage to virtual machines, containers & even physical servers which can be configured with Resiliency Factor (RF) 2 or 3, meaning two or three copies of the data is stored for resiliency and performance.

From an oversimplified view, it is easy to compare RF2 with N+1 e.g.: RAID 5 and RF3 with N+2 e.g.: RAID 6, however in reality RF2 and 3 are vastly more resilient than traditional RAID due to the distributed storage fabrics ability to rebuild from failure extremely quickly and proactive disk scrubbing to detect and resolve issues before they result in failures.

Nutanix performs checksums on every read and write as well as performs continual background scrubbing to ensure maximum data integrity. This ensures than things like Latent Sector Errors (LSEs) and Bit rot, and normal drive wear & tear is proactively detected and addressed.

A critical factor when discussing the resiliency of ADSF even when used with RF2 is the speed at which compliance with RF2 or RF3 can be restored in the event of a drive or node failure.

Because the rebuild is a fully distributed operation across all nodes and drives (i.e.: A Many to many operation), it’s both very fast and the workload per node is minimised to avoid bottlenecks and to reduce the impact to running workload.

How fast is fast? Well, of course it depends on many factors including the size of the cluster, the number/type of drives (e.g.: NVMe, SATA-SSD, DAS-SATA) as well as the CPU generation and network connectivity, but with this in mind I thought I would give an example.

The test bed is a 16 node cluster with a mix of almost 5 year old hardware including NX-6050 and NX-3050 nodes using Ivy Bridge 2560 Processors (Launched Q3, 2013), each with 6 x SATA-SSDs ranging in size and 2 x 10GB network connectivity.

For this test, no data reduction technologies (Deduplication, Compression or Erasure Coding) were in use as these would skew the performance of the rebuild depending on the data reduction achieved. The results in this test case are therefore not the best case scenario as data reduction can and does improve performance and would reduce the amount of data needing to be re-protected by the data reduction ratio.

As shown below, the nodes have a little over 5TB of data in use so the speed we’re measuring today is the performance of 5TB rebuild from a simulated node failure. Half the nodes in the cluster have approx 9TB capacity and the other half have between 3TB and 1.4TB capacity.

NodeFailure_CapacityUsage

The node failure is simulated by using the IPMI interface and using the “Power off server – immediate” option as shown below. This is the equivalent of pulling the power out of the back of a physical server.

IPMIPowerOff

The resiliency advantage of the Acropolis Distributed Storage Fabric (ADSF) is obvious when you look at the per node statistics during a node failure. We can see that well over 1GBps of throughput is driven by a single node and all nodes within the cluster are contributing roughly equal throughput based on their capacity.

DiskIONodeFailure

The reason for half the nodes throughput being lower is they have much lower capacity and therefore have less data (replicas) to provide to the rebuild. If all nodes were the same capacity, the throughput would be roughly even as shown by the first four nodes in the list.

If Nutanix did not have a distributed storage fabric, rebuilds would be constrained by the source and/or the destination node much like RAID or more basic HCI platforms e.g.: Node A replicas a large object to Node B as opposed to all nodes replicating small extents (1MB) across the entire cluster in an efficient Many to Many process.

In comparison with a traditional RAID5, the source for the rebuild is only the drives in the specific RAID where the failure occurred. RAID sets are typically between 3 and say 24 at the upper end of the spectrum, and the destination for a rebuild is a single “hot spare” or replacement drive, meaning the rebuild operation is bottlenecked by a single drive.

Almost every I.T professional has a horror story or five about data loss from RAID 5 and even RAID 6 due to subsequent failures during the extended periods of time (usually measured in hours and days) it took these RAID packs to recover from a single drive failure.

The larger the drives in the RAID pack, the longer the rebuild and the higher the risk of data loss from subsequent failures. The performance impact during RAID rebuilds is also very high due to only a subset of drives being the source and typically only one drive being the destination. This means long windows of performance impact and unprotected data.

These common bad experiences are in my opinion are a major reason why N+1 (and even RF2) is given a bad name. If RAID 5 and 6 could have rebuild from a drive failure in minutes, the vast majority of subsequent failures would likely not have resulted in downtime or data loss.

Now back to the rebuild performance of Nutanix ADSF.

Again because ADSF distributes replicas (data) throughout the cluster at 1MB granularity (as opposed to a “pair” style configuration where all data is on only 2 nodes) it allows the platform to improve write performance (as more controllers service the I/O) and during rebuilds, more controllers, CPUs, network bandwidth is available to service the rebuild.

In short, the larger the cluster, the more nodes read and write replicas and the faster the recovery can perform. The impact of a failure and rebuild is reduced the larger the cluster is, meaning larger clusters can provide excellent resiliency even with RF2.

Below is a screenshot from the Analysis tab in Nutanix HTML 5 PRISM GUI. It shows the storage pool throughput during the rebuild from the simulated node failure.

NodeFailureRebuildPerformance

As we can see, the chart shows the rebuild starts after 8.26PM and completes before 8:46PM and sustains around 9GBps throughput until completion.

So in this example, in the event of a 5 year old node with >5TB capacity usage, full data integrity is restored in less than 20 mins.

As the cluster size increases, or if newer node types were used with faster processors, NICs and storage such as NVMe drives, the rebuild would have performed significantly faster but even this shows that the risk of subsequent failures causing data loss when using RF2 (2 copies of data) is limited to a very short window.

Summary:

  • Nutanix RF2 is vastly more resilient than RAID5 (or N+1) style architectures
  • ADSF performs continual disk scrubbing to detect and resolve underlying issues before they can cause data integrity issues
  • Rebuilds from drive or node failures are an efficient distributed operation using all drives and nodes in a cluster
  • A recovery from a >5TB node failure (in this case, the equivalent of 6 concurrent SSD failures) can be less than 20mins

Next let’s discuss how to convert from RF2 to RF3 and how fast this compliance task can complete.

Index:
Part 1 – Node failure rebuild performance
Part 2 – Converting from RF2 to RF3
Part 3 – Node failure rebuild performance with RF3
Part 4 – Converting RF3 to Erasure Coding (EC-X)
Part 5 – Read I/O during CVM maintenance or failures
Part 6 – Write I/O during CVM maintenance or failures
Part 7 – Read & Write I/O during Hypervisor upgrades
Part 8 – Node failure rebuild performance with RF3 & Erasure Coding (EC-X)
Part 9 – Self healing
Part 10: Nutanix Resiliency – Part 10 – Disk Scrubbing / Checksums

Nutanix X-Ray Benchmarking tool – Snapshot Impact Scenario

In the first part of this series, I introduced Nutanix X-Ray benchmarking tool which has been designed very differently to traditional benchmarking tools as the performance of the app is the control and the variable is the platform,not the other way around.

This is done by generating realistic IO patterns (e.g.: Not 100% 4k read) and then performing functions against the platform to see how the control (the VM application performance) is impacted by the underlying platforms functionality.

A great example of this is performing snapshots as the first step in a space efficient backup solution.

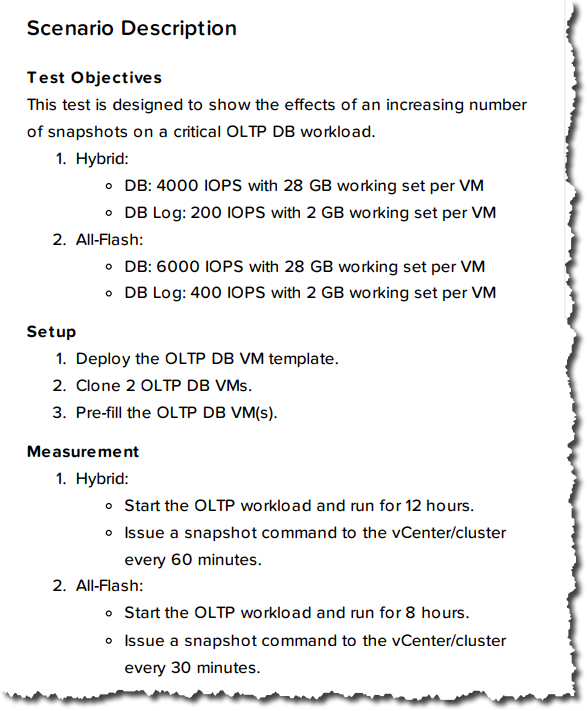
X-Ray has a built in test which generates an OLTP workload which is ran for 8 hours which for an all flash platform generates 6000 IOPS across the database and 400 IOPS for the logs. The scenario is detailed in the X-Ray report shown below.

XraySnapshotImpactDescription

The Snapshot impact scenario is then ran against multiple platforms and using the Analysis functionality within X-ray. we can generate a report which overlays the results from multiple platforms.

The below example is GA Acropolis Hypervisor (AHV) on AOS 5.1.1 verses a leading hypervisor and SDS platform showing the snapshot impact scenario.

XraySnapshotImpact

Each of the red lines indicate a snapshot and what we observe is the performance of both platforms remains consistent until the 10th snapshot (shown below) where the Nutanix platform continues without impact and the leading hypervisor and SDS platform starts degrading significantly.

XraySnapshotImpactSnap10

In the real world, customers use the intelligent features of storage, SDS or hyper-converged platforms but rarely test how this functionality works prior to purchasing. This is because it’s difficult and time consuming to do so.

Nutanix X-Ray tool makes the process of validating a platforms performance under real world scenarios a quick and easy process and provides automatically generated reports where accurate comparisons can be made.

What this example shows is that while both platforms could achieve the required performance without snapshots, only Nutanix AHV & AOS could maintain the performance while utilising snapshots to achieve the type of recovery point objective (RPO) that is expected in production environments, especially with business critical workloads.

As part of the Nutanix Solutions and Performance engineering organisation, I can tell you that the focus for Nutanix is real world performance, using data reduction, leveraging snapshots, mixing workloads and testing a large scale.

In upcoming posts I will show more examples of X-Ray test scenarios as well as comparisons between GA Acropolis Hypervisor (AHV) & AOS 5.1.1 verses a leading hypervisor and SDS platform.

Related Articles:

Nutanix X-Ray Benchmarking tool Part 1 – Introduction

Nutanix X-Ray Benchmarking tool Part 3 – Extended Node Failure Scenario

Nutanix X-Ray Benchmarking tool – Introduction

I’ve been excited to write about X-ray for a while now, but I’ve not had the time. But the opportunity has presented itself where I could kill two birds with one stone and do some performance comparisons between Nutanix AHV Turbo Mode and other platforms on the same underlying hardware, so what better time to review X-ray as part of this process.

So for those of you who have not heard of X-Ray, it wouldn’t be unreasonable to assume it’s just another benchmarking tool to further muddy the waters when comparing different platforms.

However X-Ray takes a different approach, to quote Paul Updike who is part of Nutanix Technical Marketing Engineering:

Normally performance is your test variable and you measure the effect on the system. X-ray is upside down, performance of an app in a VM is the control and our test variable is the system. We measure the effect on the control.

So if all you want is “hero numbers” you’ve come to the wrong place, although  X-Ray does have a peak performance micro-benchmark test built-in, it’s far from real world in comparison to the other tests within X-ray.

The X-Ray virtual appliance is recommended to be ran on a cluster which is not the target for the testing, such as a management cluster. But for those environments where this additional hardware may not be available, it can also be deployed on VirtualBox or VMware Workstation on your PC or laptop.

Also if you have an Intel NUC, you could deploy Nutanix Community Edition (CE) and run X-Ray on CE which is based on AHV.

In addition to the different approach X-ray takes to benchmarking, I like that X-ray performs fully automated testing across multiple hypervisors including ESXi, AHV as well as different underlying storage. This helps ensure consistent and fair comparisons between platforms, or even comparisons between Nutanix node types if you decide to compare model types before making a purchasing decision.

X-ray has several built in tests which are focused not just on outright performance, but on how a system functions and performs during node failure/s, with snapshots as well as during rolling upgrades.

The reason Nutanix took this approach is because it is much more real world than simply firing up I/O meter with lots of outstanding I/O with a 100% random 4k read. In the real world, customers performance upgrades (hopefully regularly to take advantage of new functionality and performance!), hardware does fail when we can least afford it and using space efficient snapshots as part of an overall backup strategy makes a lot of sense.

Now let’s take a look at the X-Ray interface starting with an overview:

XrayOverview

X-Ray is designed to be similar to PRISM to keep that great Nutanix look and feel. The tool is very simple to use with three sections being Tests, Analyses and Targets.

To get started is very quick/easy, just open the “Targets” view (shown below) and select “New Target”.

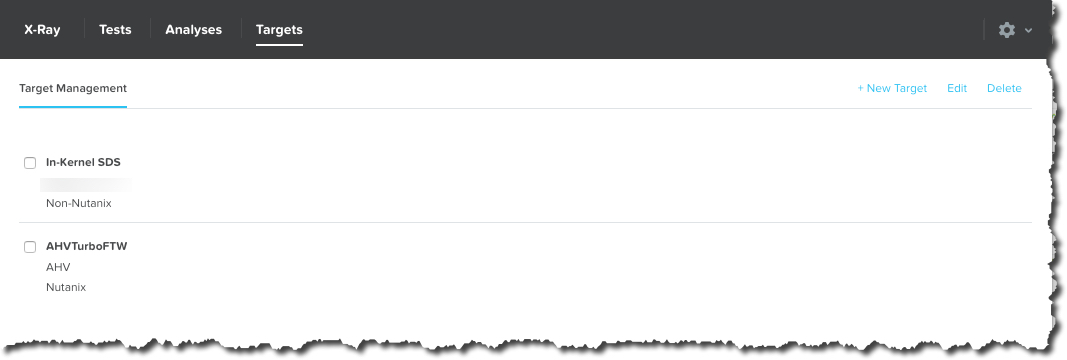
XrayTargets

In the “Create Target” popup, you simply, provide a name for the target e.g.: “Nutanix NX-3460 Cluster AHV”, select the Manager type, being either vCenter for ESXi environments or PRISM for AHV.

Then select the cluster type, being Nutanix (i.e.: A Nutanix NX, Dell XC, Lenovo HX or HPE/Cisco software only) OR “Non-Nutanix” which is for comparisons with platforms not running Nutanix AOS such as VMware vSAN.

XrayCreateTarget

For VMware environments, you then provide the vCenter details and regardless of the hardware type or platform, you supply the out of band management (e.g.: IPMI) details. The out of band management details allow X-ray to perform simulated hardware failure tests which are critical to any product evaluation and pre-production operational verification testing.

X-Ray then allows you to select the cluster, container (or datastore) and networking (e.g.: Port Group) to be used for the testing.

XrayCreateTarget_Cluster

X-ray then discovers the nodes (e.g.: ESXi Hosts) and allows you to add nodes and confirm the IPMI type to ensure maximum compatibility.

XrayCreateTarget_Node

Now hit “Save” and you’re good to go! Pretty simple right?

Now to run a test, simply click the test you want to run and select “Add to Queue”.

Xray_RunTestVDISim

The beauty of this is X-ray allows you to queue as many tests as you want and leave the system to run the tests, say overnight or over a weekend without requiring you to monitor them and start tests one by one.

In between tests the target systems are cleaned up (i.e.: data and VMs deleted) to ensure consistent / fair results even when running test packages one after another.

Once a test has been ran, you can view the results in the X-Ray GUI (as shown below):

XrayTestsOverview

You can also generate a PDF report for individual tests or perform analysis between two tests including of different platforms:

XrayAnalyses

The above results show and overlay between two platforms, the first being AHV (although it’s incorrectly named Turbo mode when it was ran using non Turbo mode AOS version 5.1.1). As we can see, AHV even without turbo mode was more consistent than the other platform.

To create a PDF report, simply use the “Actions” drop down menu and select “Create Report”.XrayCreateReport

The report will create a report which covers off details about X-ray, the Target cluster/s, the scenario being tested and the test results.

XrayTOCReport

It will show simple results such as if the test passed (i.e.: Completed the required tasks) and things like test duration as shown below:

XrayReportTargetOverview

X-Ray also provides built-in tests for mixed workloads, which is much more realistic than testing peak performance for point (or siloed) solutions which are become more and more rare these days. XrayMixedWorkloads

X-Ray’s built in tests are also auto scaling based on the cluster size of the target and allow tuning of the scenario. For example, in the VDI simulator scenario, Task, Knowledge or Power Users can be selected.

XRayVDISimulator
Summary:

X-Ray provides a tool which is free of charge, multi-hypervisor, multi-platform (including non-HCI) which is easy to use for proof of concepts, product comparisons as well as real world, operational verification.

I am working with the X-ray team to develop new built in test scenarios to simulate real world scenarios for business critical applications as well as to allow customers and 3rd parties to validate the benefits of functionality such as data locality.

The following is a series of posts covering Nutanix AHV Turbo Mode performance/functionality comparisons with other products.

Nutanix X-Ray Benchmarking tool Part 2 -Snapshot Impact Scenario

Nutanix X-Ray Benchmarking tool Part 3 – Extended Node Failure Scenario