Uploading ISOs & VM Images to Acropolis Hypervisor (AHV)

A common question is how do I upload an ISO or Virtual machine image to the Acropolis Hypervisor, well in NOS 4.5 this task just got radically simpler.

The below shows the “Home” screen in PRISM UI. As we can see in the top left we are running the Acropolis Hypervisor (AHV) version 20150616.

By clicking the gear wheel at the top right, we can then access the “Image Configuration” menu.PRISMHomeImageService

The “Image configuration” menu is a quick and easy way to upload ISOs and Virtual Machine images to Acropolis.

Below we can see its a very simple process, simply give the Image a name along with annotation, select from a drop-down list the Image type, being ISO or Disk (RAW format, .img) and then select the image source, either from a URL or by uploading a file from your machine.

CreateImage

Once you have selected your ISO or Disk, hit save and the image will be uploaded and the status of the upload will be shown as per the below:

CreateImageUploading

Once its completed, PRISM shows the following Summary:

ImageConfigurationSuccess

Now when you create a new VM, you will be able to select “Clone from Image Service” and select the ISO Image from a drop-down list. How simple is that!

CDROMimageservice

Simple as that! Now you can boot your VM and start using the ISO. The same process can also be used to upload VM disk images.

Advanced Storage Performance Monitoring with Nutanix

Nutanix provides excellent performance monitoring and analytic capabilities through our HTML 5 based PRISM UI, but what if you want to delve deeper into the performance of a specific business critical application?

Nutanix also provides advanced storage performance monitoring and workload profiling through port 2009 on any CVM which shows very granular details for Virtual disks.

By default, Nutanix secures our CVM and the http://CVM_IP:2009 page is not accessible, but for advanced troubleshooting this can be enabled by using the following command.

sudo iptables -t filter -A WORLDLIST -p tcp -m tcp –dport 2009 -j ACCEPT


When accessing the 2009 page (which is part of the Nutanix process called “Stargate”) you will see things like Extent (In Memory Read) cache usages and hits as well as much more.

On the main 2009 page you will see a section called “Hosted VDisks” (shown below) which shows all the current VDisks (equivalent of a VMDK in ESXi) which are currently running on that node.

HostedvDisks


The Hosted VDisks shows high level details about the VDisk such as Outstanding Operations, capacity usage, Read/Write breakdown and how much data is in the OpLog (Persistent Write Cache).

If you need more information, you can click on the “VDisk Id” and you will get to a page titled “VDisk XXXXX Stats” where the XXXXX is the VDisk ID.

The below is some of the information which can be discovered in the VDisk Stats Page.

VDisk Working Set Size (WWS)

The working set size can be thought of as the data which you would ideally want to fit within the SSD tier of a Nutanix node, which would result in all-flash type performance.

In the below example, in the last 2mins, the VDisk had a combined (or Union) working set of 6.208GB and over the last 1hr over 111GB.

WSSExchange


VDisk Read Source

The Read Source is simply what tier of storage is servicing the VDisks IO requests. In the below example, 41% was from Extent Cache (In Memory), 7% was from the SSD Extent Store and 52% was from the SATA Extent Store.
ReadSource


In the above example, this was an Exchange 2013 workload where the total dataset was approx 5x the size of the SSD tier. The important point here is its not always possible to have all data in the SSD tier, but its critical to ensure consistent performance. If 90% was being served from SATA and performance was not acceptable, you could use this information to select a better node to migrate (vMotion) the VM too, or help choose to purchase a new node.

VDisk Write Destination

The Write Destination is fairly self explanatory, if its Oplog it means its Random IO and its being written to SSD, if its straight to the extent store (SSD) it means the IO is either sequential, OR in rare cases the OpLog is being bypassed if the SSD tier reached 95% full (which is generally prevented by Nutanix ILM tiering process).

WriteDestination

VDisk Write Size Distribution

The Write Size Distribution is key to determining things like the Windows Allocation Size when formatting drives as well as understanding the workload.

WriteSizeOverall

VDisk Read Size Distribution

The Read Size Distribution is similar to Write Size in that its key to determining things like the Windows Allocation Size when formatting drives as well as understanding the workload. In this case, a 64k allocation size would be ideal as both the Write (shown above) and the Read (below) are >32K and <64K 86% of the time. (Which is expected as this was an Exchange 2013 workload).

ReadSizeExchange

VDisk Write Latency

The Write Latency shows the percentage of Write I/O which are serviced within the latency ranges shown. In this case, 52% of writes are sub-millisecond. It also shows for this vDisk 1% of IO being outliers being served between 5-10ms. This is something that outside of a lab, if the outliers were a significant percentage that could be investigated to ensure the VM disk configuration (e.g.: PVSCSI and number of VMDKs) is optimal.

WriteLatency

VDisk Ops and Randomness

Here we see the number of IOPS, the Read/Write split, MB/s and the split between Random and Sequential.

vDisksOps

Summary

For any enterprise grade storage solution, it is important that performance monitoring be easy as it is with Nutanix via PRISM UI, but also to be able to quickly and easily dive deep into very granular details about a specific VM or VDisk. The above shows just a glimpse of the information which is tracked by default for all VDisks allowing customers , partners and Nutanix support to quickly and easily monitor & profile workloads.

Importantly these capabilities are hypervisor agnostic giving customers the same capabilities no matter what choice/s they make.


Related Posts:

1. Scaling Hyper-converged solutions – Compute only.

2. Acropolis Hypervisor (AHV) I/O Failover & Load Balancing

3. Advanced Storage Performance Monitoring with Nutanix

4. Nutanix – Improving Resiliency of Large Clusters with Erasure Coding (EC-X)

5. Nutanix – Erasure Coding (EC-X) Deep Dive

6. Acropolis: VM High Availability (HA)

7. Acropolis: Scalability

8. NOS & Hypervisor Upgrade Resiliency in PRISM

Scaling problems with traditional shared storage

At VMware vForum Sydney this week I presented “Taking vSphere to the next level with converged infrastructure”.

Firstly, I wanted to thank everyone who attended the session, it was a great turnout and during the Q&A there were a ton of great questions.

One part of the presentation I got a lot of feedback on was when I spoke about Performance and Scaling and how this is a major issue with traditional shared storage.

So for those who couldn’t attend the session, I decided to create this post.

So lets start with a traditional environment with two VMware ESXi hosts, connected via FC or IP to a Storage array. In this example the storage controllers have a combined capability of 100K IOPS.

50kIOPS

As we have two (2) ESXi hosts, if we divide the performance capabilities of the storage controllers between the two hosts we get 50K IOPS per node.

This is an example of what I have typically seen in customer sites, and day 1, and performance normally meets the customers requirements.

As environments tend to grow over time, the most common thing to expand is the compute layer, so the below shows what happens when a third ESXi host is added to the cluster, and connected to the SAN.

33KIOPS

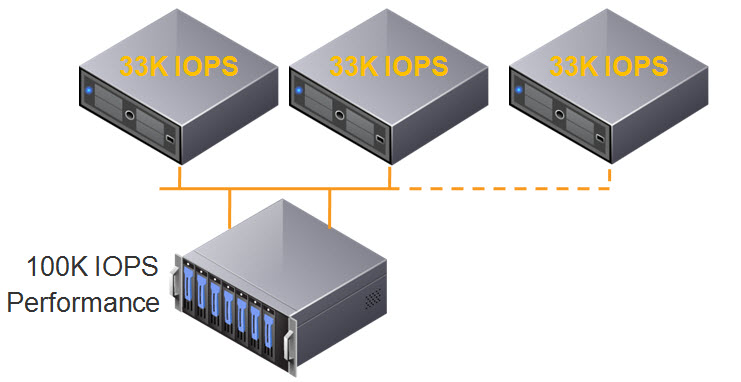
The 100K IOPS is now divided by 3, and each ESXi host now has 33K IOPS.

This isn’t really what customers expect when they add additional servers to an environment, but in reality, the storage performance is further divided between ESXi hosts and results in less IOPS per host in the best case scenario. Worst case scenario is the additional workloads on the third host create contention, and each host may have even less IOPS available to it.

But wait, there’s more!

What happens when we add a forth host? We further reduce the storage performance per ESXi host to 25K IOPS as shown below, which is HALF the original performance.

25KIOPS

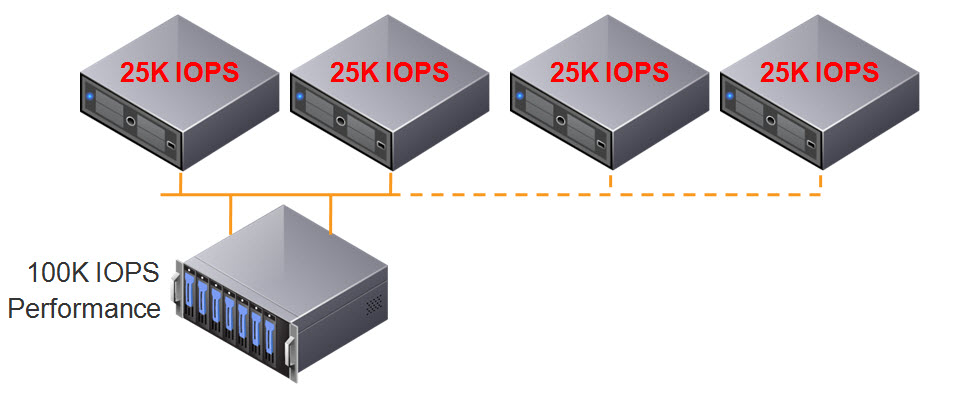
At this stage, the customers performance is generally significantly impacted, and there is no easy or cost effective resolution to the problem.

….. and when we add a fifth host? We continue to reduce the storage performance per ESXi host to 20K IOPS which is less than half its original performance.

20KIOPS

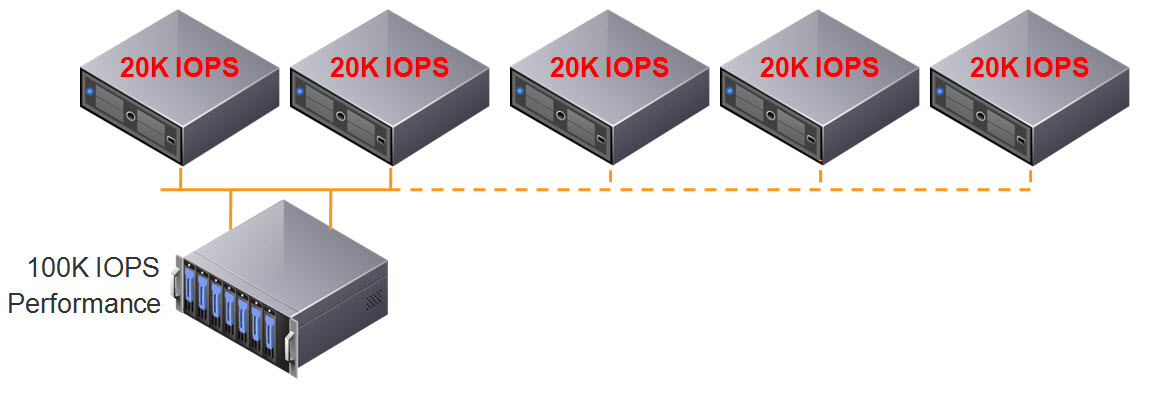
So at this stage, some of you may be thinking, “yeah yeah, but I would also scale my storage by adding disk shelves.”

So lets add a disk shelf and see what happens.

20KIOPSAddDiskShelf

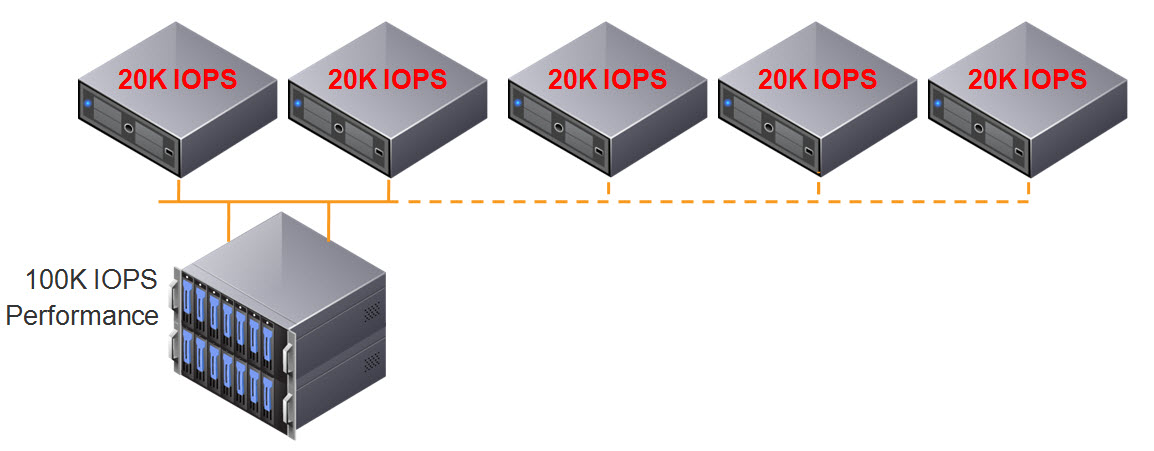
We still only have 100K IOPS capable storage controllers, so we don’t get any additional IOPS to our ESXi hosts, the result of adding the additional disk shelf is REDUCED performance per GB!

Make sure when your looking at implementing, upgrading or replacing your storage solution that it can actually scale both performance (IOPS/throughput) AND capacity in a linear fashion,otherwise your environment will to some extent be impacted by what I have explained above. The only ways to avoid the above is to oversize your storage day 1, but even if you do this, over time your environment will appear to become slower (and your CAPEX will be very high).

Also, consider the scaling increments, as a solutions ability to scale should not require you to replace controllers or disks, or have a maximum number of controllers in the cluster. it also should scale in both small, medium and large increments depending on the requirements of the customer.

This is why I believe scale out shared nothing architecture will be the architecture of the future and it has already been proven by the likes of Google, Facebook and Twitter, and now brought to market by Nutanix.

Traditional storage, no matter how intelligent does not scale linearly or granularly enough. This results in complexity in architecture of storage solutions for environments which grow over time and lead to customers spending more money up front when the investment may not be realised for 2-5 years.

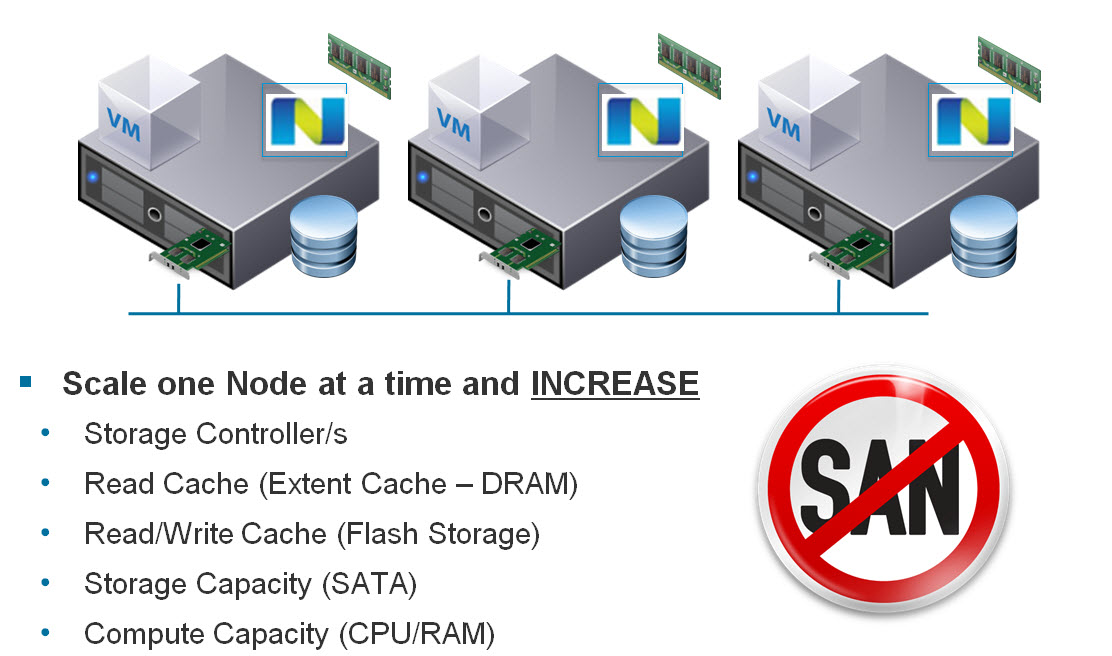
I’d prefer to be able to Start small with as little as 3 nodes, and scale one node at a time (regardless of node model ie: NX1000 , NX3000 , NX6000) to meet my customers requirements and never have to replace hardware just to get more performance or capacity.

Here is a summary of the Nutanix scaling capabilities, where you can scale Compute heavy, storage heavy or a mix of both as required.

ScaingSolution