NOS 4.5 Delivers Increased Read Performance from SATA

In a recent post I discussed how NOS 4.5 increases the effective SSD tier capacity by performing up-migrations on only the local extent as opposed to both RF copies within the Nutanix cluster. In addition to this significant improvement in usable SSD tier, in NOS 4.5 the read performance from the SATA tier has also received lots of attention from Nutanix engineers.

What the Solutions and Performance Engineering team have discovered and been testing is how we can improve SATA performance. Now ideally the active working set for VMs will fit within the SSD tier, and the changes discussed in my previous post dramatically improve the chances of that active working set fitting within the SSD tier.

But there are situation when reads to cold data still need to be serviced by the slow SATA drives. Nutanix uses Data Locality to ensure the hot data remains close to the application to deliver the lowest latency and overheads which improve performance, but in the case of SATA drives and the fact data is infrequently accessed from SATA means that reading from remote SATA drives can improve performance especially where the number of local SATA drives is limited (in some cases to only 2 or 4 drives).

Most Nutanix nodes have 2 x SSD and 4 x SATA so best case you will only see a few hundred IOPS from SATA as that is all they are physically capable of. To get around this issue.

NOS 4.5 introduces some changes to the way in which we select a replica to read an egroup from the HDD tier. Periodically NOS (re)calculate the average IO latencies of the all the replicas of a vdisk’s (replicas which have the vdisk’s egroups). We use this information to choose a replica as follows:

  1. If the latency of the local replica is less than a configurable threshold, read from the local replica.
  2. If the latency of the local replica is more than a configurable threshold, and the latency of the remote replica is more than that of the local replica, prefer the local replica.
  3. If the latency of the local replica is more than a configurable threshold and the remote replica is lower than the configurable threshold OR lower than the local copy, prefer the remote replica.

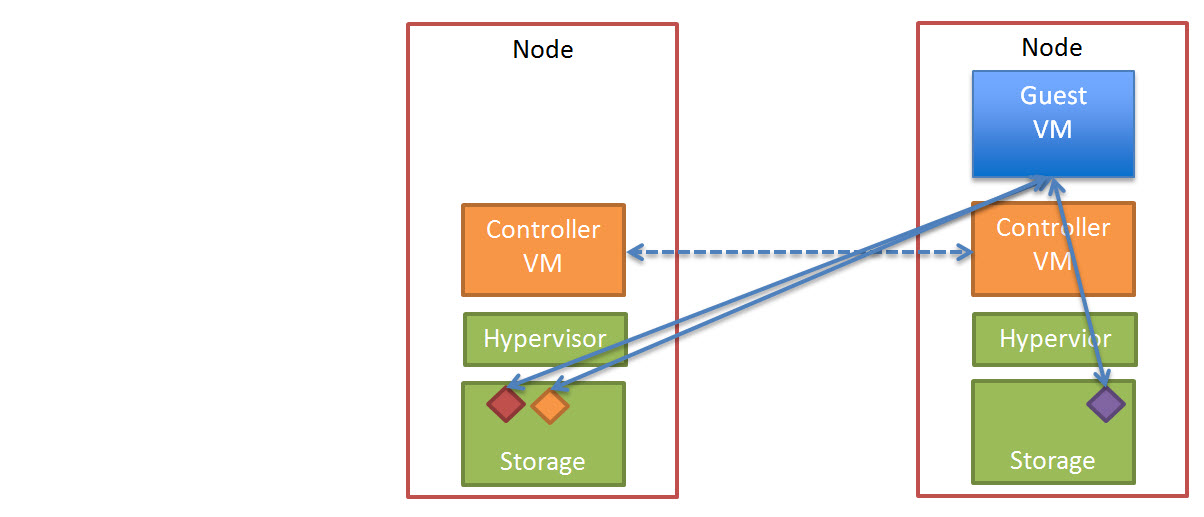
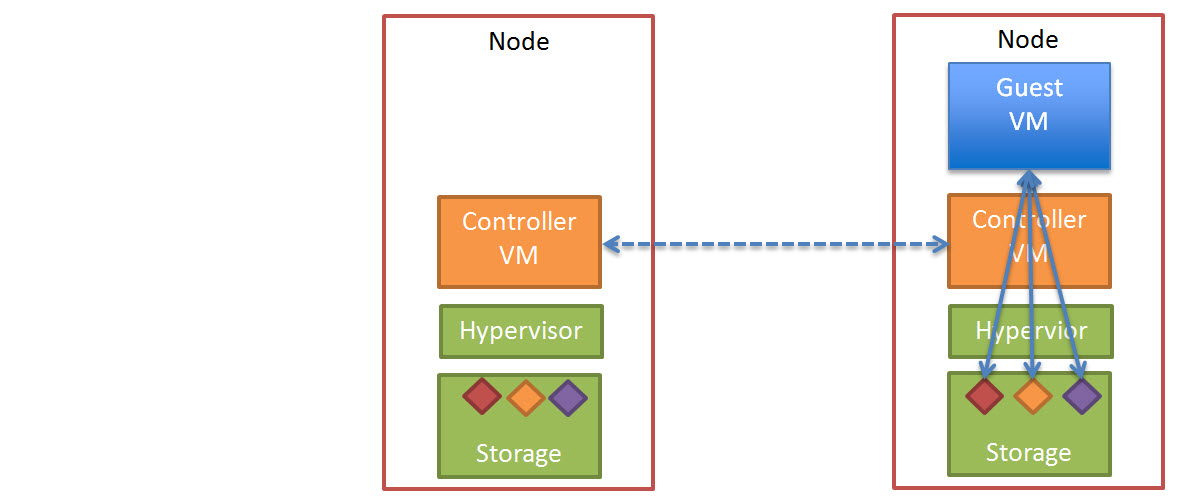
The diagram below shows an example of where the VM on Node A is performing random reads to data A and shortly thereafter data C. When requesting reads from data A the latency is below the threshold but when it requests data C, NOS detects that the latency of the local copy is higher than the remote copy and selects the remote replica to read from. As the below diagram shows, one possible outcome when reading multiple pieces of data is one read is served locally and the other is serviced remotely.

remotesatareads2

Now the obvious next question is “What about Data Locality”.

Data Locality is being maintained for the hot data which resides in SSD tier because reads from SSD are faster and have lower overheads on CPU/Network etc when read locally due to the speed of SSDs. For SATA reads which are typical >5ms the SATA drive itself is the bottleneck not the network, so by distributing the Reads across more SATA drives even if they are not local, results in better overall performance and lower latency.

Now if the SSD tier has not reached 75% all data will be within the SSD tier and will be served locally, the above feature is for situations where the SSD tier is 75% full and data is being tiered to SATA tier AND random reads are occurring to cold data OR data which will not fit in the SSD tier such as very large databases.

In addition NOS 4.5 detects if the read I/O is random or sequential, and if its sequential (which SATA performance much better at) then the up-migration of data has a higher threshold to meet before being migrated to SSD.

The result of these algorithm improvements (and the increased SSD tier effective capacity discussed earlier) and Nutanix In-line compression is higher performance over larger working sets which also exceed the capacity of the SSD tier.

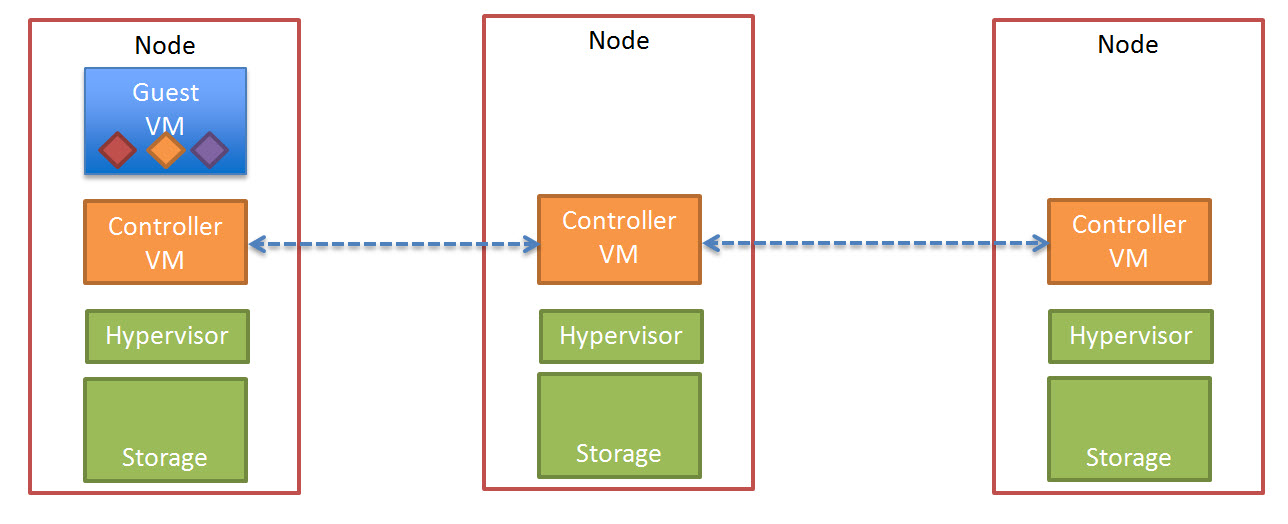
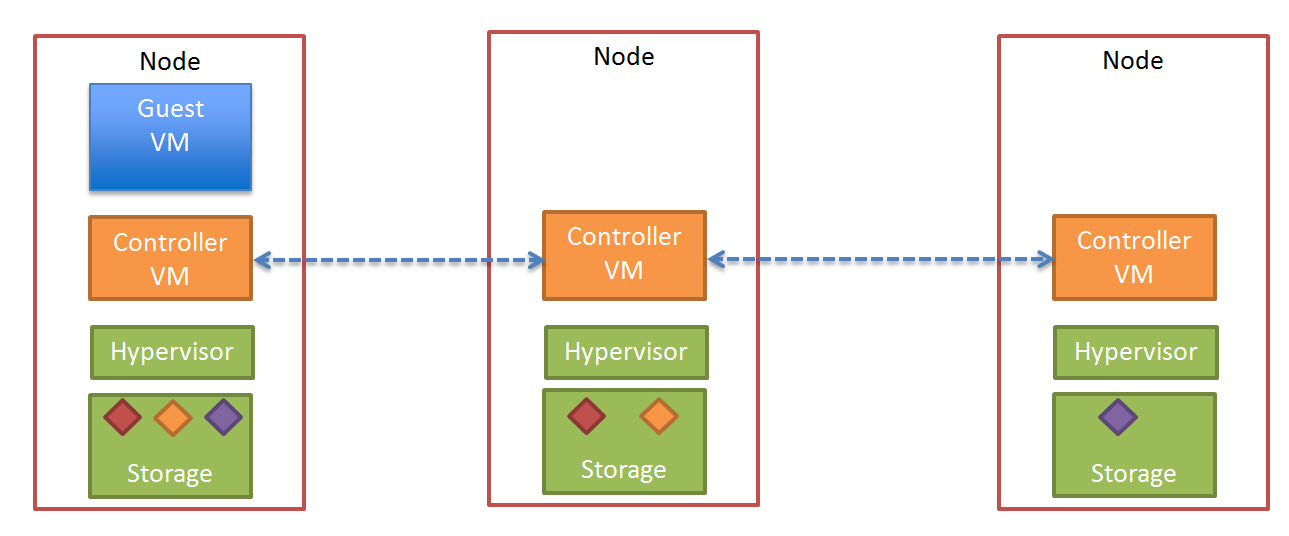
Effectively NOS 4.5 is delivering a truly scale out solution for read I/O from SATA tier which means one VM can be reading from potentially all nodes in the cluster ensuring SATA performance for things like Business Critical Applications is both high and consistent. Combine that with NX-6035C storage only nodes, this means SATA read I/O can be scaled out as shown in the below diagram without scaling compute.

ScaleOutRemoteReads


As we can see above, the Storage only Nodes (NX-6035C) are delivering additional performance for read I/O from the SATA tier (as well as from the SSD tier).

Advanced Storage Performance Monitoring with Nutanix

Nutanix provides excellent performance monitoring and analytic capabilities through our HTML 5 based PRISM UI, but what if you want to delve deeper into the performance of a specific business critical application?

Nutanix also provides advanced storage performance monitoring and workload profiling through port 2009 on any CVM which shows very granular details for Virtual disks.

By default, Nutanix secures our CVM and the http://CVM_IP:2009 page is not accessible, but for advanced troubleshooting this can be enabled by using the following command.

sudo iptables -t filter -A WORLDLIST -p tcp -m tcp –dport 2009 -j ACCEPT


When accessing the 2009 page (which is part of the Nutanix process called “Stargate”) you will see things like Extent (In Memory Read) cache usages and hits as well as much more.

On the main 2009 page you will see a section called “Hosted VDisks” (shown below) which shows all the current VDisks (equivalent of a VMDK in ESXi) which are currently running on that node.

HostedvDisks


The Hosted VDisks shows high level details about the VDisk such as Outstanding Operations, capacity usage, Read/Write breakdown and how much data is in the OpLog (Persistent Write Cache).

If you need more information, you can click on the “VDisk Id” and you will get to a page titled “VDisk XXXXX Stats” where the XXXXX is the VDisk ID.

The below is some of the information which can be discovered in the VDisk Stats Page.

VDisk Working Set Size (WWS)

The working set size can be thought of as the data which you would ideally want to fit within the SSD tier of a Nutanix node, which would result in all-flash type performance.

In the below example, in the last 2mins, the VDisk had a combined (or Union) working set of 6.208GB and over the last 1hr over 111GB.

WSSExchange


VDisk Read Source

The Read Source is simply what tier of storage is servicing the VDisks IO requests. In the below example, 41% was from Extent Cache (In Memory), 7% was from the SSD Extent Store and 52% was from the SATA Extent Store.
ReadSource


In the above example, this was an Exchange 2013 workload where the total dataset was approx 5x the size of the SSD tier. The important point here is its not always possible to have all data in the SSD tier, but its critical to ensure consistent performance. If 90% was being served from SATA and performance was not acceptable, you could use this information to select a better node to migrate (vMotion) the VM too, or help choose to purchase a new node.

VDisk Write Destination

The Write Destination is fairly self explanatory, if its Oplog it means its Random IO and its being written to SSD, if its straight to the extent store (SSD) it means the IO is either sequential, OR in rare cases the OpLog is being bypassed if the SSD tier reached 95% full (which is generally prevented by Nutanix ILM tiering process).

WriteDestination

VDisk Write Size Distribution

The Write Size Distribution is key to determining things like the Windows Allocation Size when formatting drives as well as understanding the workload.

WriteSizeOverall

VDisk Read Size Distribution

The Read Size Distribution is similar to Write Size in that its key to determining things like the Windows Allocation Size when formatting drives as well as understanding the workload. In this case, a 64k allocation size would be ideal as both the Write (shown above) and the Read (below) are >32K and <64K 86% of the time. (Which is expected as this was an Exchange 2013 workload).

ReadSizeExchange

VDisk Write Latency

The Write Latency shows the percentage of Write I/O which are serviced within the latency ranges shown. In this case, 52% of writes are sub-millisecond. It also shows for this vDisk 1% of IO being outliers being served between 5-10ms. This is something that outside of a lab, if the outliers were a significant percentage that could be investigated to ensure the VM disk configuration (e.g.: PVSCSI and number of VMDKs) is optimal.

WriteLatency

VDisk Ops and Randomness

Here we see the number of IOPS, the Read/Write split, MB/s and the split between Random and Sequential.

vDisksOps

Summary

For any enterprise grade storage solution, it is important that performance monitoring be easy as it is with Nutanix via PRISM UI, but also to be able to quickly and easily dive deep into very granular details about a specific VM or VDisk. The above shows just a glimpse of the information which is tracked by default for all VDisks allowing customers , partners and Nutanix support to quickly and easily monitor & profile workloads.

Importantly these capabilities are hypervisor agnostic giving customers the same capabilities no matter what choice/s they make.


Related Posts:

1. Scaling Hyper-converged solutions – Compute only.

2. Acropolis Hypervisor (AHV) I/O Failover & Load Balancing

3. Advanced Storage Performance Monitoring with Nutanix

4. Nutanix – Improving Resiliency of Large Clusters with Erasure Coding (EC-X)

5. Nutanix – Erasure Coding (EC-X) Deep Dive

6. Acropolis: VM High Availability (HA)

7. Acropolis: Scalability

8. NOS & Hypervisor Upgrade Resiliency in PRISM

Write I/O Performance & High Availability in a scale-out Distributed File System

Following on from my recent post titled “Data Locality & Why is important for vSphere DRS clusters” I would like to discuss at a high level how Write I/O works in the Nutanix Distributed File System, how the solution ensures high availability in the event of a node failure and what impact a failure has on performance.

Lets start with a typical Write operation.

The below diagram shows a three (3) node Nutanix cluster with a Guest VM starting to perform write I/O, this is represented in a simplistic manor by the three (3) Diamonds (Red, Yellow and Purple)

NutanixWriteIOstart

The write I/O is written to the local SSD tier (as is every Write in a Nutanix environment) as shown below.

NutanixWriteDataWrittenLocal

Before acknowledging the write the Nutanix Controller VM (CVM) then replicates a copy of the data across the Nutanix Distributed File System.

The below diagram illustrates what this looks like in a three node cluster.

NutanixWriteSyncToOtherNodes

Once the data in successfully written to other nodes within the cluster, the Write acknowledgement is given. This ensures data is consistent and always protected.

In a Nutanix cluster, as Controllers (Nutanix CVMs) are scaled linearly with the ESXi hosts, Write I/O is then spread over more controllers, reducing the chance of contention in the environment at both a storage controller and network layer as each controller shares 2 x 10Gb connections per node.

In the event of a node failure, in a vSphere cluster, HA will restart the failed VM/s onto a surviving node in the cluster.

The VM will start-up and operate as normal and where data is not local to the node (as discussed in detail in my post  “Data Locality & Why is important for vSphere DRS clusters“) the data will initially be accessed over 10Gb before being replicated locally for future reads.

NutanixHAAfterWithDataAccess

All future writes for the VM/s which have been restarted by HA on different nodes will perform at a similar rate (if not the same rate) as they did before the failure depending on how many nodes are in the cluster. Where the Network is not a bottleneck, there should be minimal/no difference in write performance after a node failure.

The Nutanix cluster will also detect a node has failed, and ensure two copies of all data are available, and in the above example where only one copy of the data exists, the cluster will replicate the required data to ensure High Availability (“Replication Factor” of 2) is maintained.

As this replication is done across multiple controllers and nodes, it is much faster and lower impact than a traditional RAID rebuild which most of us will be familiar with.

The end state of this process looks like this.

NutanixHAEndState

So in conclusion using a “scale-out” storage controller solution like Nutanix ensures consistent high write performance even immediately following a node failure by eliminating the requirement for RAID style rebuilds which are disk intensive and can lead to “Double Disk Failures” and data loss.

The replication of data being distributed across all nodes in the cluster ensures minimal impact to each Nutanix controller, ESXi host and the network while ensuring the data is re-protected as soon as possible.

Related Articles

1. Data Locality & Why is important for vSphere DRS clusters