Nutanix X-Ray Benchmarking tool – Snapshot Impact Scenario

In the first part of this series, I introduced Nutanix X-Ray benchmarking tool which has been designed very differently to traditional benchmarking tools as the performance of the app is the control and the variable is the platform,not the other way around.

This is done by generating realistic IO patterns (e.g.: Not 100% 4k read) and then performing functions against the platform to see how the control (the VM application performance) is impacted by the underlying platforms functionality.

A great example of this is performing snapshots as the first step in a space efficient backup solution.

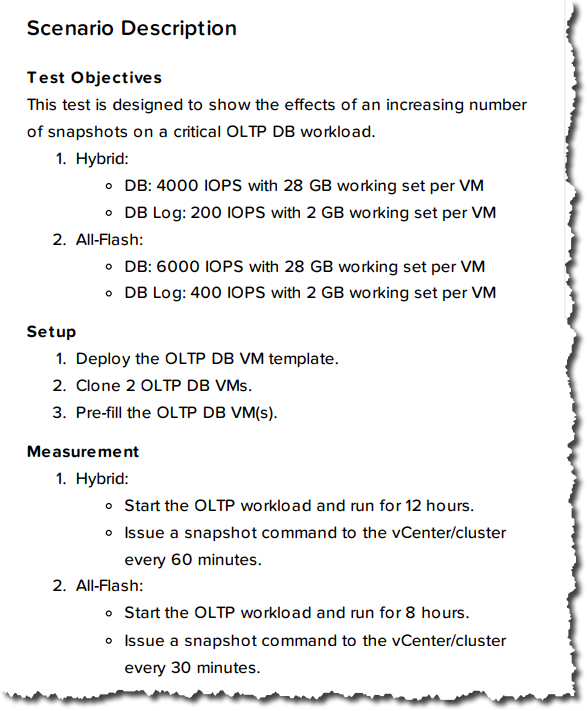
X-Ray has a built in test which generates an OLTP workload which is ran for 8 hours which for an all flash platform generates 6000 IOPS across the database and 400 IOPS for the logs. The scenario is detailed in the X-Ray report shown below.

XraySnapshotImpactDescription

The Snapshot impact scenario is then ran against multiple platforms and using the Analysis functionality within X-ray. we can generate a report which overlays the results from multiple platforms.

The below example is GA Acropolis Hypervisor (AHV) on AOS 5.1.1 verses a leading hypervisor and SDS platform showing the snapshot impact scenario.

XraySnapshotImpact

Each of the red lines indicate a snapshot and what we observe is the performance of both platforms remains consistent until the 10th snapshot (shown below) where the Nutanix platform continues without impact and the leading hypervisor and SDS platform starts degrading significantly.

XraySnapshotImpactSnap10

In the real world, customers use the intelligent features of storage, SDS or hyper-converged platforms but rarely test how this functionality works prior to purchasing. This is because it’s difficult and time consuming to do so.

Nutanix X-Ray tool makes the process of validating a platforms performance under real world scenarios a quick and easy process and provides automatically generated reports where accurate comparisons can be made.

What this example shows is that while both platforms could achieve the required performance without snapshots, only Nutanix AHV & AOS could maintain the performance while utilising snapshots to achieve the type of recovery point objective (RPO) that is expected in production environments, especially with business critical workloads.

As part of the Nutanix Solutions and Performance engineering organisation, I can tell you that the focus for Nutanix is real world performance, using data reduction, leveraging snapshots, mixing workloads and testing a large scale.

In upcoming posts I will show more examples of X-Ray test scenarios as well as comparisons between GA Acropolis Hypervisor (AHV) & AOS 5.1.1 verses a leading hypervisor and SDS platform.

Related Articles:

Nutanix X-Ray Benchmarking tool Part 1 – Introduction

Nutanix X-Ray Benchmarking tool Part 3 – Extended Node Failure Scenario

Dare2Compare Part 6 : Nutanix data efficiency stats can’t be found

If you’ve not read Parts 1 through 5, we have already proven several claims by HPE Simplivity regarding Nutanix to be false, as well as explored the misleading way in which HPE SVT promote data efficiency.

We continue with Part 6 where we will discuss HPE’s claim that “Nutanix data efficiency stats are stealthier than a ninja”. (below)

While HPE’s claim is an attempt to create Fear, Uncertainty and Doubt (FUD), HPE are partially correct in that we (Nutanix) have done a very poor job of promoting the arguably market leading data efficiency that Nutanix provides.

In fact, several colleagues and I created a feature request to properly report in a clear and detailed way, the ADSF data efficiencies and I am pleased to say these changes were included as part of the recent AOS 5.1 release.

Now what Nutanix users see in PRISM “Storage” view is (as shown below):

  1. A Capacity optimization overview
  2. Data reduction ratio which is made up of deduplication, compression and erasure coding savings*.
  3. Data reduction savings which is a total GB/TB/PB value from data reduction
  4. An Overall Efficiency ratio which is a combination of Data Reduction, Cloning and Thin Provisioning

*Metadata copies/snapshops/pointers etc are not included in the deduplication value as they are not deduplication.

The resulting summary is very clear and easy to understand so customers can see what efficiencies are from data reduction, and which savings (which typically form by far the largest “efficiency”) come from Cloning and thin provisioning.

DataReductionSummary2

One major item which will be included in an upcoming release is zero suppression. Zero suppression is a capability which has been in Nutanix Distributed Storage Fabric since Day 1 and it avoids unnecessarily storing zeros, instead storing metadata which achieves the same outcome but is much higher performance and uses much less capacity.

Nutanix snapshots or pointer based copies (depending on how you refer to them) are also not included in the overall efficiency number, however these will also be included as a seperate line item in a future release as we aim to be very clear regarding what data efficiencies a customer is achieving with Nutanix.

Some vendors recommend Eager Zero Thick (EZT) VMDKs on vSphere, and then deduplicate the zeros which artificially increases the deduplication ratio. Nutanix does not do this as it’s inefficient to create more data to deduplicate when you can simply avoid writing the data in the first place. However we do plan to report the savings from Zero suppression as a seperate line item as it is a value our platform provides.

For a more detailed view, Nutanix customers can dive down into the storage,Diagram view where admins can view of each containers data efficiency breakdown (as shown below).

DetailedContainerView

As we can see, Nutanix is very transparent showing what data reduction features are enabled, what ratio is being achieved, the total, used, reserved and even Thick Provisioned storage with an effective free based on physical multiplied by data reduction ratio and an overall efficiency value.

Now that we’ve covered off how Nutanix measures and reports on data reduction/efficiency, I’d like to highlight a critical factor when discussing data reduction/efficiency and that is that data efficiency is totally dependant on the individual customers data. For the same dataset, the difference between vendors with the same capabilities, e.g.: Deduplication, Compression and Erasure Coding (EC-X) are unlikely to be vastly different (or better put, change a business outcome one way or another) despite what each vendor will say about their implementation of such technologies.

In short: The biggest factor in the achieved data reduction is not the vendor, it’s the customer data.

With that said, if you’re comparing HPE SVT and Nutanix, then there is a pretty major delta between the two products in terms of capabilities and that is because Nutanix supports Erasure Coding (EC-X) and HPE SVT does not.

As a result, Nutanix has a major advantage as Erasure Coding in the Nutanix Acropolis Distributed Storage Fabric (ADSF) is complimentory to both deduplication and compression.

Unlike Compression and Deduplication, Erasure Coding can provide savings (or another way to look at it would be lower data redundancy overheads) regardless of the data type.

So where Deduplication and Compression will get minimal/no savings for data such as Video files, Erasure Coding still provides savings so the delta between Nutanix and HPE SVT will only increase in Nutanix favour the less the customer data will dedupe and/or compress.

HPE SVT on the other hand has a RAID (RAID 6 being N-2 usable or RAID 60 being N-4 usable) overhead and on top of that, use replication (2 copies / 50% usable) for an usable capacity (of raw) of well below 50% depending on the number of drives per node.

Nutanix, using RF2 and EC-X provides between 50% (minimum) and 80% (maximum) usable capacity of RAW and with RF3 (N+2) between 33% (minimum) and 66% (maximum) usable excluding the benefits of compression and deduplication.

The next major factor in data efficiency ratios is how they are measured!

In Part 1 I have already covered how misleading HPE SVT’s 10:1 efficiency guarantee is, and this is a great example of why it can be difficult to compare apples/apples between vendors. Nutanix on the other hand does not measure data efficiency in the same misleading manner.

In Summary:

  1. Nutanix AOS 5.1 has comprehensive data reduction/efficiency reporting within the PRISM HTML GUI
  2. Nutanix data reduction capabilities exceed that of HPE SVT as both products have Dedupe and Compression, but Erasure Coding (EC-X) is only supported on Nutanix
  3. All data reduction capabilities on Nutanix are complimentory, so Dedupe , Compression and Erasure Coding can all work together to maximise savings.
  4. Erasure Coding provides data reduction even for data which is not compressible or dedupeable
  5. Nutanix data efficiency stats are easily visible in the PRISM GUI and are much more detailed than HPE SVT

Return to the Dare2Compare Index:

But wait, there’s more!

As far as data reduction results are concerned, they are all over twitter and a simple search comes up with many examples. The first one being my favorite. Not because of the data reduction ratio itself but because it shows one of the major values of a 100% software solution where a simple software upgrade (which is one-click rolling, non-disruptive) provided the customer a significantly higher data reduction ratio. So basically, the customer got more capacity for free!

Note: None of the below show the latest data efficiency reporting capabilities from AOS 5.1.

Here are a few other examples which I found using this Twitter search:

Dare2Compare Part 5 : Nutanix can’t claim single screen management w/o extra fees or GUIs

If you’ve not read Parts 1,2,3 and 4, we have already proven several claims by HPE Simplivity regarding Nutanix to be false, as well as explored the misleading way in which HPE SVT promote data efficiency.

The fun continues and in Part 5 we will discuss HPE’s claim that Nutanix does not have a “single screen management” (by which I assume they mean Single Pane of Glass) without extra fees or GUIs.

Unfortunately the URL was not working in the HPE tweet, I responded and made HPE aware of this so I could review specifically what they are claiming, but the link at the time of writing is still not working.

It’s funny HPE SVT mention this because Nutanix is the only HCI product which has a built in, distributed, scalable and multi hypervisor management solution.

The fact Nutanix has its own interface is a huge advantage especially because Nutanix is not dependant on any 3rd parties (e.g.: VMware vCenter) to install/configure and manage our platform. This reduces cost,complexity,risk,operational tasks and the list goes on.

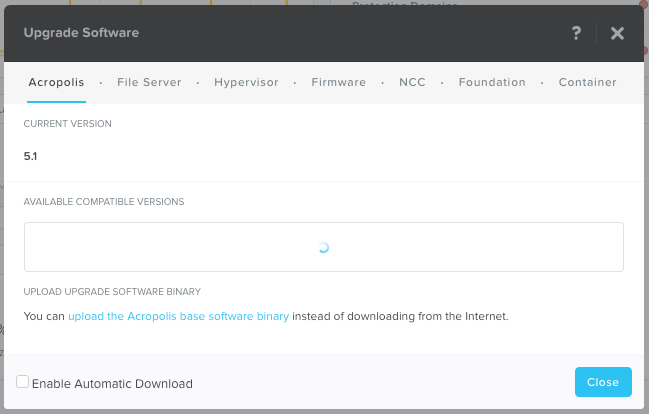
Nutanix “PRISM Element” HTML 5 GUI is built into every Nutanix solution regardless of hypervisor or underlying hardware. The below screenshot shows the built in management capabilities to upgrade the Nutanix Acropolis (AOS) storage layer, the built in, scale out file server, the hypervisor (ESXi, Hyper-V or AHV) as well as upgrade Firmware, our Container support and our built in cluster imaging tool, Foundation.

PrismUogradeSoftware

This means regardless of hypervisor, many of the critical tasks can be performed straight within PRISM and does not require the long in the tooth VMware Update Manager (VUM) which is long overdue for an overhaul. In fact, Nutanix supports four (4) hypervisors using our management tool (PRISM) whereas HPE SVT only has GA support for ESXi.

For customers using Acropolis Hypervisor (AHV), 100% of the management can be performed within PRISM Element and central management of multiple clusters is performed through PRISM Central.

AHV comes with all Nutanix solutions at no extra cost regardless of hardware choice (including HPE Proliant). This means customers enjoy the benefits of the next generation hypervisor, designed and built for HCI and Enterprise Cloud.

Unlike HPE SVT for example, Nutanix does not have a limit of 8 nodes per datacenter or 32 per “federation”, PRISM element can support a cluster of any size (currently no support limits) and PRISM central manages all the clusters.

Nutanix management is not tied to or more importantly dependant on VMware vCenter or any other hypervisor management tool, which adds to the resiliency and simplicity of the Nutanix platform. PRISM automatically scales in both performance and resiliency as a cluster expands to ensure consistent performance for system administrators. This avoids the complexity of designing/installing and maintaining a highly available vCenter solution which also uses additional compute and storage resources.

Summary:

  1. Nutanix PRISM Element GUI is built in and comes included with every Nutanix deployment
  2. Nutanix PRISM is not limited by the number of nodes it can manage
  3. PRISM Central is used to manage multiple Nutanix clusters centrally if required but is not mandatory.
  4. Nutanix provides at no cost the next generation hypervisor (AHV) which has 100% of all management performed within PRISM GUIs.
  5. AHV eliminates the requirement for Hypervisor licensing (e.g.: VMware vSphere) which actually reduces overall costs, this is unique to Nutanix.
  6. PRISM supports 4 hypervisors (ESXi , Hyper-V, AHV and XenServer) which delivers a consistent management interface for multi-hypervisor environments which are becoming more and more common.

Many of the above points are unique to Nutanix and have been designed and built to be a truly webscale platform, not a ROBO/SMB or <32 node solution. Nutanix can start small and continue to scale to any size, with the PRISM Element management stack automatically scaling to suit as nodes are added.

Return to the Dare2Compare Index: