At Nutanix inaugural user conference in 2015, Storage Only nodes were announced which allowed customers for the first time to scale capacity without having to add compute nodes. This allows customers more flexibility and eliminates the need to license the storage nodes for vSphere as storage only nodes run Acropolis Hypervisor (AHV) and are managed entirely through PRISM.
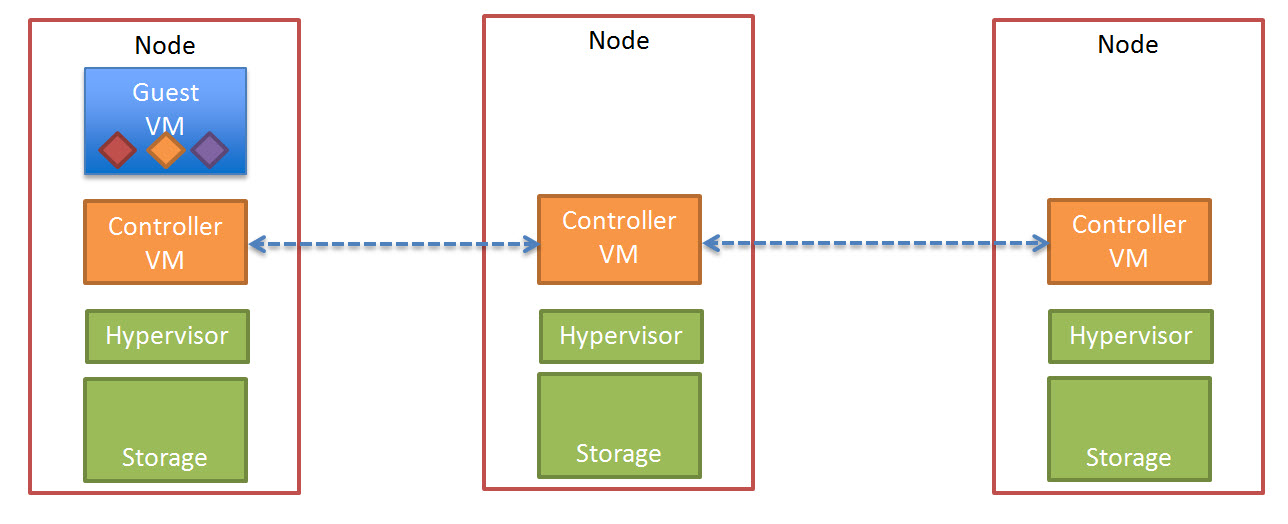
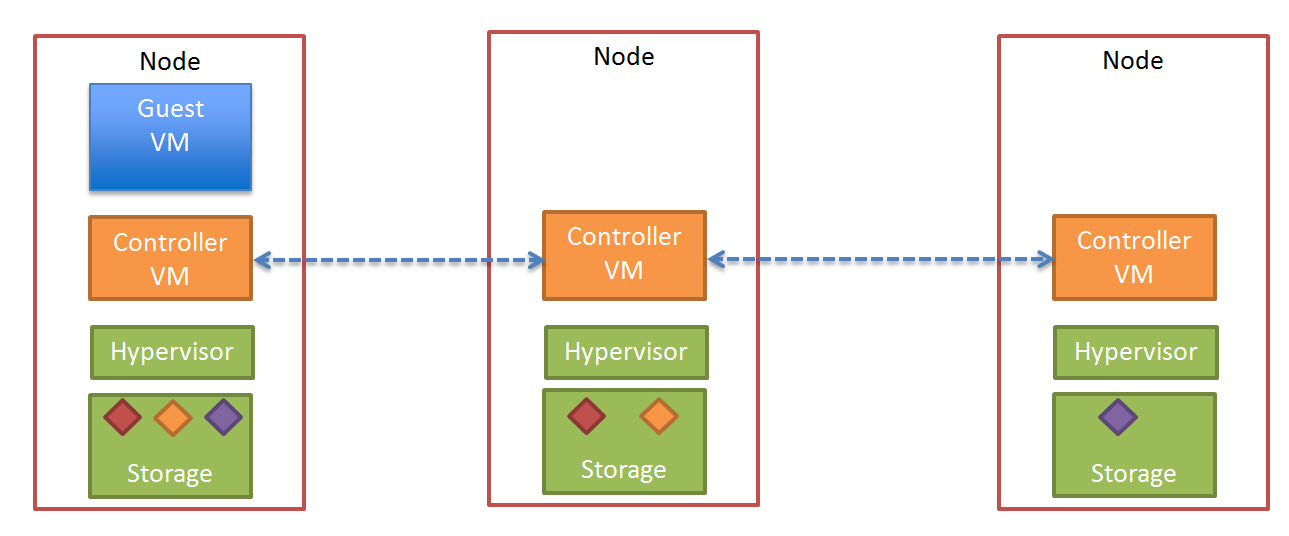
A common question from prospective and existing Nutanix customers is what if my VMs storage exceeds the capacity of a Nutanix node? The answer is detailed in this blog post but in short, as the Acropolis Distributed Storage Fabric (ADSF) distributes data throughout the cluster at a 1MB granularity, a VMs storage can exceed the local node and performance even improves including reads from the capacity (SAS/SATA) tier.
Storage only nodes were previously limited to the NX-6035C (and Dell XC/Lenovo HX equivalents) but at Nutanix .NEXT conference in Las Vegas 2016, it was announced that any node (including all-flash) can be a storage only node.
This means even for high performance and/or high capacity environments, Nutanix clusters can be scaled without the need to add compute node or purchase additional licensing if you are running vSphere as the hypervisor.
However to date Nutanix are yet to publish any performance data showing the value of storage only nodes, so I decided to run a few tests and demonstrate the value of the Acropolis Distributed Storage Fabric (ADSF) and Storage Only Nodes.
Before we get to the performance data, to avoid competitors inevitable attempts to create FUD about Nutanix performance, I will not be publishing the exact specifications of the node types, drive or Jetstress configurations. I will be publishing the IOPS/latency and database creation, duplication and checksumming durations of the direct comparisons which clearly show the performance advantage of storage only nodes.
Jetstress was not configured to demonstrate maximum performance of the underlying Nutanix solution, it was configured to achieve around 1000 IOPS which is typically higher than even a large Exchange deployment requires per instance. This also allows this test to demonstrate how performance improves when the cluster is performing real world levels of IO (at least in the case of Exchange for this example).
The performance advantage will vary between node types and based on how many storage only nodes are added to the cluster. But the point of this example is to show that ADSF is a truely distributed storage fabric and the storage only nodes and additional Nutanix Controller VMs (CVMs) servicing replication (RF) traffic and remote reads significantly improves performance for VMs residing on the Compute+Storage nodes.
Test Overview:
The first test will be performed using four Jetstress VMs running on a four node cluster. The second test will be performed after an additional four storage only nodes are added to the cluster to form an eight node cluster. Before the second test the cluster will be wiped of all data with the exception of the Windows 2012 R2 template and all Jetstress DBs will be created from scratch so we can compare DB creation as well as performance and DB checksumming durations. Wiping all data also ensures there is no pre-warming of the extent cache (in memory read cache) or metadata cache.
Test Preparation:
I performed a cluster stop / cluster destroy / cluster create to ensure the cluster is totally clean and that we have a fair baseline for the test. The cluster was made up of four nodes.
I then created a base Windows 2012 R2 virtual machine with 4 PVSCSI adapters and 9 vDisks, one for the OS, 4 for the DBs and 4 for the logs. DB drives were formatted with 64k allocation size and log drives with 4k as the different allocation size and seperate virtual disks has shown approx 25% performance improvement in my testing not to mention I recommend In-Line compression and Erasure Coding (EC-X) for Exchange databases and no data reduction for logs.
Jetstress was configured to use 80% of the vDisks capacity which resulted in approx 80% of the Nutanix storage pool capacity being utilised for the test. I will point out these were not low capacity nodes such as NX3060s so the database creation time is significant because there was lots of data to create.
I then cloned the VM 3 times and spread the 4 VMs across 4 Nutanix Nodes running ESXi 5.5 Update 3.
Test 1: Create Databases and run 2hr test
The databases creation phase creates one database, then Jetstress duplicates the database in this case 3 times and immediately after creation the performance test begins.
Note: No data reduction was used for this test as it will result in unrealistic data reduction and performance results as I described in the post Jetstress Testing with Intelligent Tiered Storage Platforms.
I configured Jetstress in this way to ensure the extent cache (in memory read cache) was not pre-warmed and so the results of the test would be fair and repeatable.
Once the performance test completed, I waited for each test to complete before allowing the database checksum validation task to complete. (This is done by using the Multi-host option in Jetstress).
The results for each of the four Jetstress VMs are shown below including the average across the VMs for each of the difference metrics.

Observations from Test 1:
- We achieved the desired >1000 IOPS per VM
- Performance was consistent across all Jetstress instances
- Log writes were in the 1ms range as they were serviced by the ADSF Oplog (persistent write buffer)
- Database reads were on average just under 10ms which is well below the Microsoft recommended 20ms
- The Database creation time averaged 2hrs 24mins
- The duplication of 3 databases averaged 4hrs 17mins
- The database checksum took on average around 38mins
Test 2: Delete all data, Add four nodes to the cluster & repeat test 1
All Jetstress VMs were deleted and a full curator scan manually initiated to ensure all data was fully removed from disk prior to beginning the next test which ensured a fair baseline.
Four Jetstress VMs were then deployed from the same template, powered on and the saved Jetstress configuration was applied before beginning the test.
Note: The Jetstress thread count was not changed and remains the same as for Test 1.
As with Test 1 the databases creation phase created one database, then Jetstress duplicates the database 3 times and immediately after creation the performance test begins and ran for the same 2hr duration.
The results for each of the four Jetstress VMs are shown below including the average across the VMs for each of the difference metrics.

Observations from Test 2:
- Achieved IOPS jumped by almost 2x
- Log writes average latency was lower by 13%
- Database write latency dropped by >20%
- Database read latency dropped by almost 2x
- The Database creation time was just under 15 mins faster
- The duplication of 3 databases improved by almost 35 mins
- The database checksum was 40 seconds faster.
Without changing the Jetstress thread count, due to the improved performance of the cluster the achieved IOPS jumped by 2x!!
Summary:
These tests is a clear demonstration of the scalability advantage of the Acropolis Distributed Storage Fabric (ADSF) and storage only nodes for customers wanting to increase performance and/or capacity in their HCI environment.
The ability of ADSF to distribute write IO across all nodes within a cluster means write performance improves significantly with the addition of nodes (including storage only) to the cluster while reducing read and write latency due to the decreased workload on the compute + storage nodes servicing the VMs.
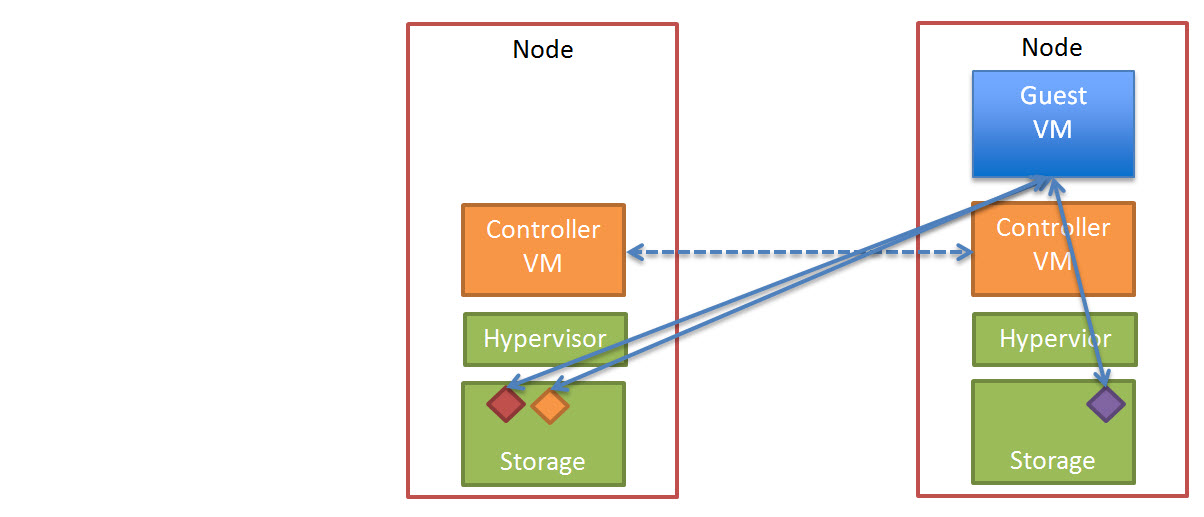
But data locality is lost with storage only nodes, right?
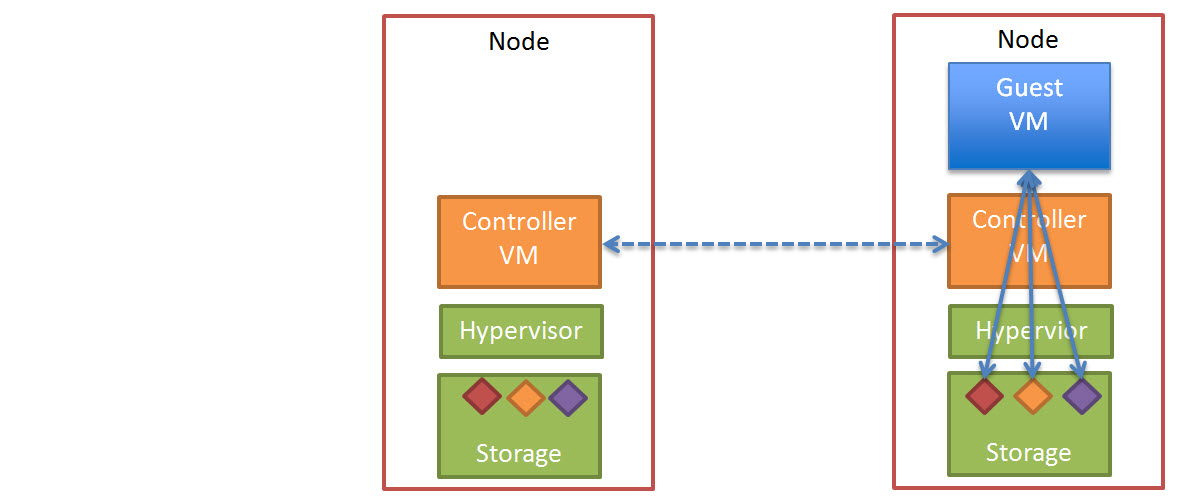
Wrong! Storage only nodes actually improve (yes, improve!) data locality by maximising the amount of available space on the compute+storage nodes. This is as a direct result of storage only nodes accepting replication data for write IO and storing the 2nd or 3rd copies (in the case of RF3) on the storage only nodes. This is also demonstrated by the lower read latency observed during this test.
Storage only nodes not only improve the performance and capacity for Virtual machines, but also for physical servers using Acropolis Block Services (ABS) and users of Acropolis File Services (AFS) both of which had enhancements announced at .NEXT 2016 this year.