SQL & Exchange performance in a Virtual Machine

The below is something I see far to often: An SQL or Exchange virtual machine using a single LSI Logic SAS virtual SCSI controller.

LSIlogic

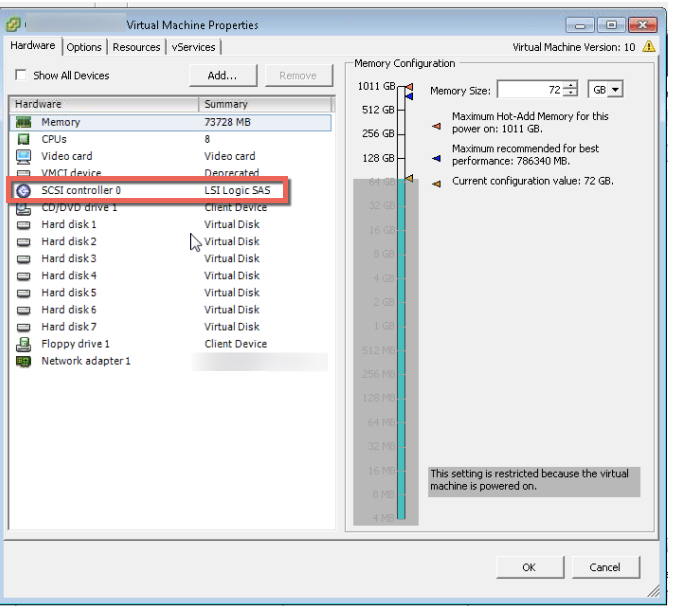
What is even worse is a virtual machine using a single LSI controller and a single virtual disk for one or more databases and logs (as shown above).

Why is this so common?

Probably because the LSI Logic SAS controller is the default for Windows 2008/2012 virtual machines and additional SCSI controllers are not automatically added until you have more than 16 virtual disks for a single VM.

Why is this a problem?

The LSI controller has a queue depth limit of 128, compared to the default limit for PVSCSI which is 256, however it can be tuned to 1024 for higher performance requirements.

As a result, the a configuration with a single LSI controller and/or a limited number of virtual disks can artificially significantly constrain the underlying storage from delivering the performance it is capable of.

Another problem with the LSI controller is the amount of CPU it uses is higher than the PVSCSI controller for the same IO levels. This means you’re wasting virtual machine (and the underlying hosts) CPU resources unnecessarily.

Using more CPU could lead to other problems such as CPU Ready which can also lead to reduced performance.

A colleague and friend of mine, Michael Webster wrote a great post titled: Performance Issues Due To Virtual SCSI Device Queue Depths where he shows the performance difference between SATA, LSI and PVSCSI controllers. I highly recommend having a read of this post.

What is the solution?

Using multiple Paravirtual (PVSCSI) adapters with virtual disks evenly spread over the four controllers for Windows virtual machines is a no brainer!

This results in:

  1. Higher default queue depth
  2. Lower CPU overheads
  3. Higher potential performance

How do I configure this?

It’s fairly straight forward, but don’t just change the LSI Controller too PVSCSI as the Guest OS may not have the driver installed which will result in the VM failing to boot.

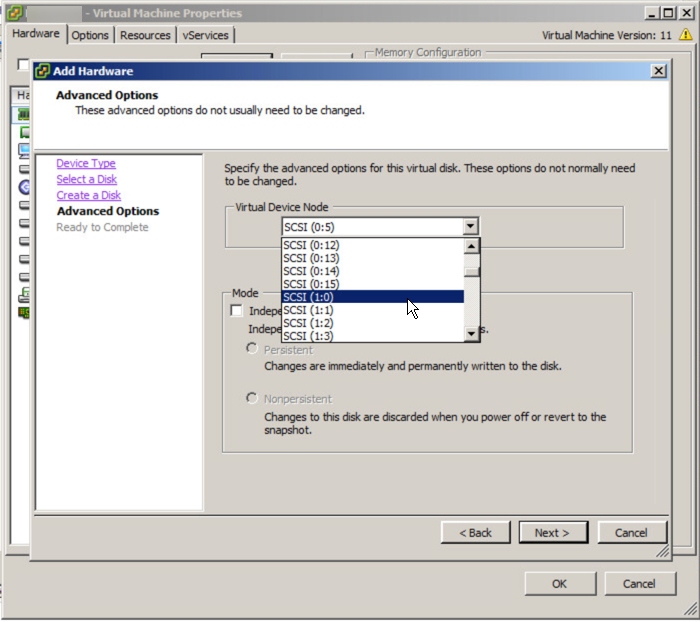
Too avoid this, simply edit the virtual machine and add a new Virtual Disk of any size and for the virtual device node, select SCSI (1:0) and follow the prompts.

VirtualDiskSCSI10

Once the new virtual disk is added you should see a new LSI Logic SAS SCSI controller is added as shown below.

NewLSIController

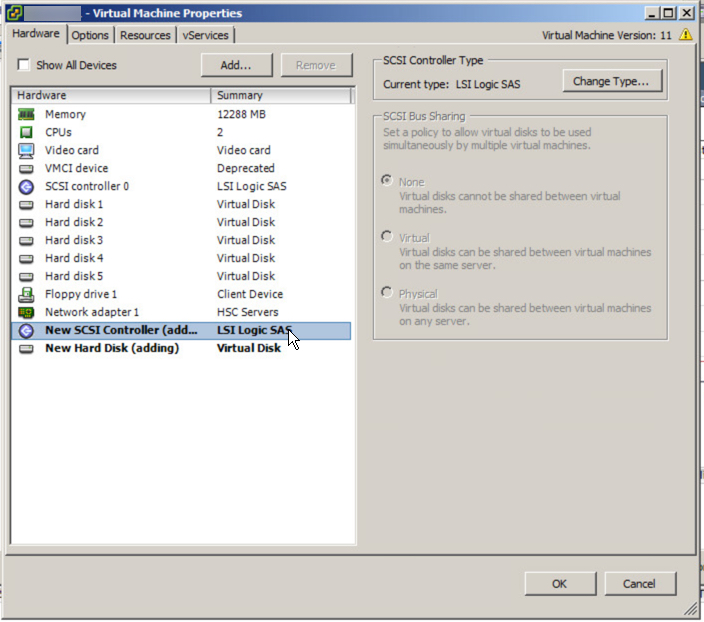
Next highlight the adapter and select “Change Type” in the top right hand corner of the window and select Paravirtual. Once this is complete you should see similar to the below:

AddPVSCSIController

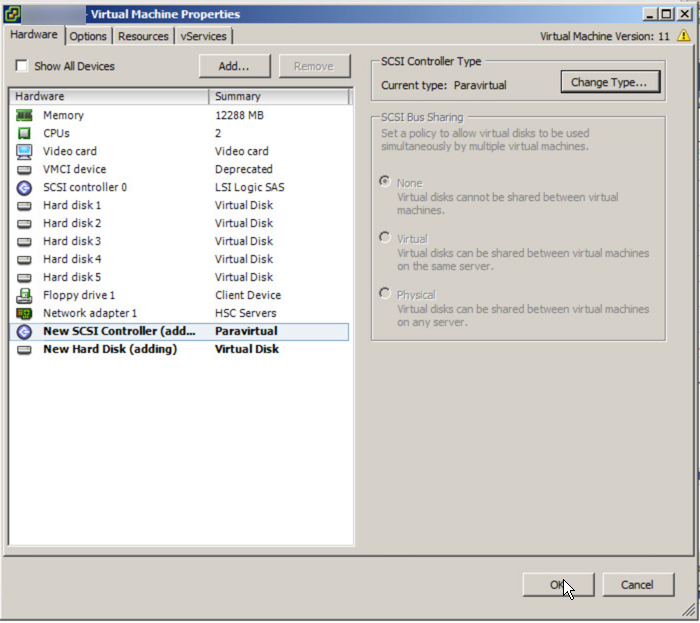
Next hit “Ok” and the new Controller and virtual disk will be added to the VM.

Now we open the console of the VM and open Compute Management and goto Device Manager. Under Storage Controllers you should now see VMware PVSCSI Controller as shown below.

DeviceManagerPVSCSI

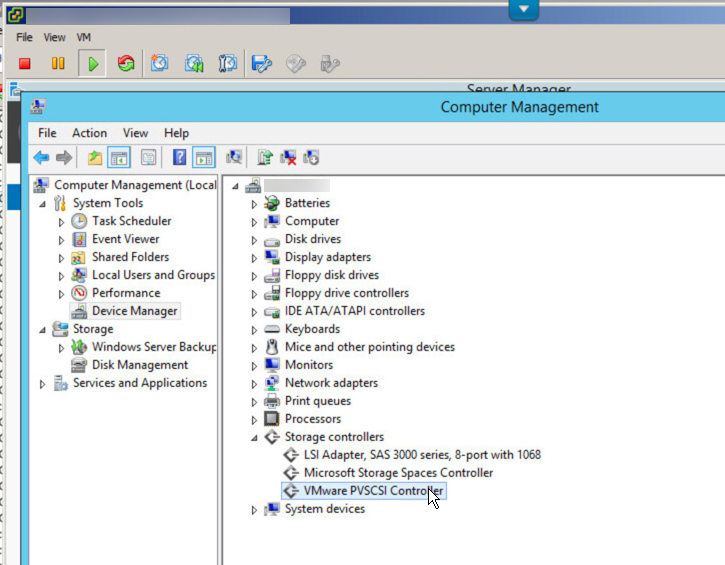
Now we are safe to Shutdown the VM.

Once the VM is shutdown, Edit the VM setting and highlight the SCSI Controller 0 and select Change Type as we did earlier and select Paravirtual. Once this is done you will see the original controller is replaced with a new controller.

ChangeLSItoPVSCSI

Now that we have the boot drive change to PVSCSI, we can now balance the data drives across up to four PVSCSI controllers for maximum performance.

To do this, simply highlight a Virtual Disk and drop down the Virtual Device Node and select SCSI (1:0) or any other available slot on the SCSI (1:x) controller.

ChangeControllerID

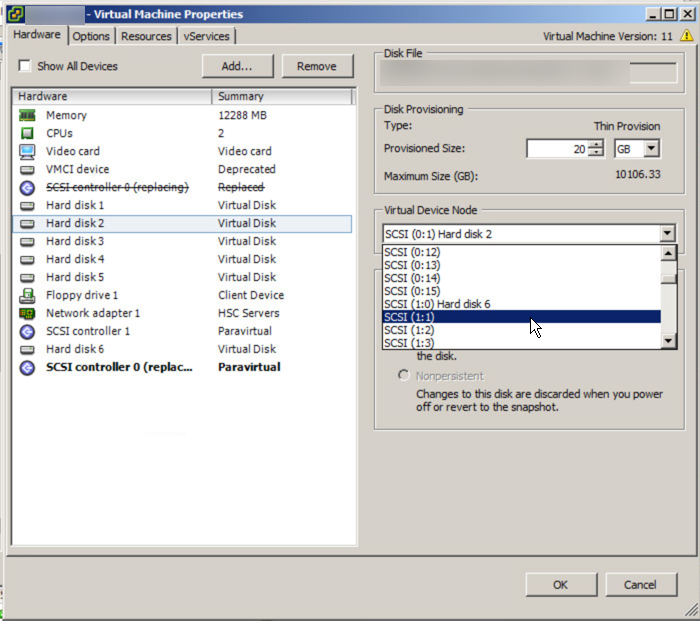
After doing this you will see new SCSI controllers appear and you need to change these to Paravirtual as we have done to the first controller.

ChangeControllerIDMultipleVdisks

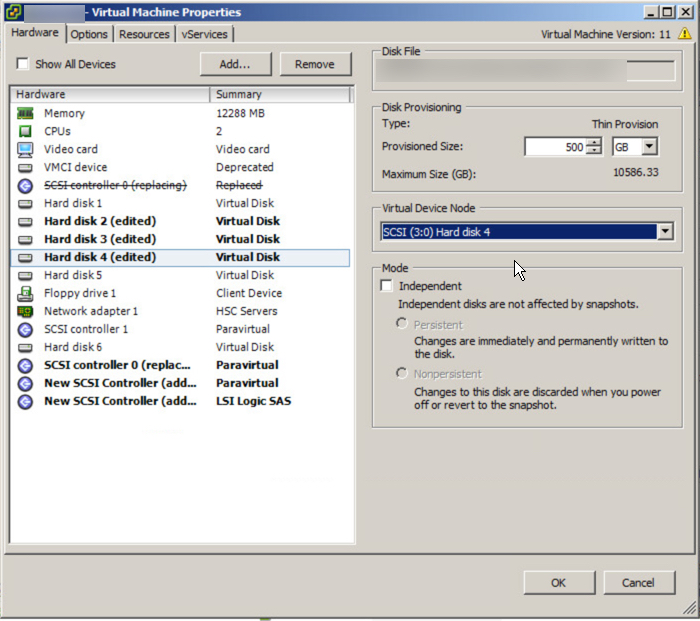
For each of the virtual disks, ensure they are placed evenly across the PVSCSI controllers. For example, if you have a VM with eight virtual disks plus the OS disk, it should look like this:

Virtual Disk 1 (OS) : SCSI (0:0)
Virtual Disk 2 (OS) : SCSI (0:1)
Virtual Disk 3 (OS) : SCSI (1:0)
Virtual Disk 4 (OS) : SCSI (1:1)
Virtual Disk 5 (OS) : SCSI (2:0)
Virtual Disk 6 (OS) : SCSI (2:1)
Virtual Disk 7 (OS) : SCSI (3:0)
Virtual Disk 8 (OS) : SCSI (3:1)
Virtual Disk 9 (OS) : SCSI (0:2)

This results in two data virtual disks per PVSCSI controller which evenly distributes IO across all controllers with the exception being first controller (SCSI 0) also hosting the OS drive.

What if I have problems?

On occasions I have seen problems with this process which has resulted in VMs not booting, however these issues are easy to fix.

If your VM fails to boot with a message like “Operating System not found”, I suggest you panic! Just kidding, this is typically just the boot order of the Virtual machine has been screwed up. Just go into the bios and check the boot order has the PVSCSI controller showing and the correct virtual disk in first priority.

If the VM boots and BSOD or crashes and goes into a continuous reboot loop then power off the VM and set the first SCSI controller where the boot disk is running back to LSI. Then reboot the VM and make sure the PVSCSI driver is showing up (if its not you didn’t follow the above instructions) so go back and follow them so the PVSCSI driver is loaded and working, then shutdown and change the SCSI controller back to PVSCSI and you should be fine.

If the VM boots and one or more drives do not show up in my computer, go into Disk Manager and you may see the drives are marked as offline. Simply right click the drive and mark it as online and reboot and you’re good to go.

Summary:

If you have made the intelligent move to virtualize your business critical applications, firstly congratulations! However as with physical hardware, Virtual machines also have optimal configurations so make sure you use PVSCSI controllers with multiple virtual disks and have your DBA span the database across multiple virtual disks for maximum performance.

The following post shows how to do this in detail:

Splitting SQL datafiles across multiple VMDKs for optimal VM performance

If the DBA is not confident doing this, you can also just add multiple virtual disks (connected via multiple PVSCSI controllers) and create a stripe in guest (via Disk Manager) and this will also give you the benefit of multiple vdisks.

Related Articles:

1. Peak Performance vs Real World Performance

2. Enterprise Architecture & Avoiding tunnel vision

3. Microsoft Exchange 2013/2016 Jetstress Performance Testing on Nutanix Acropolis Hypervisor (AHV)

Scale out performance testing with Nutanix Storage Only Nodes

At Nutanix inaugural user conference in 2015, Storage Only nodes were announced which allowed customers for the first time to scale capacity without having to add compute nodes. This allows customers more flexibility and eliminates the need to license the storage nodes for vSphere as storage only nodes run Acropolis Hypervisor (AHV) and are managed entirely through PRISM.

A common question from prospective and existing Nutanix customers is what if my VMs storage exceeds the capacity of a Nutanix node? The answer is detailed in this blog post but in short, as the Acropolis Distributed Storage Fabric (ADSF) distributes data throughout the cluster at a 1MB granularity, a VMs storage can exceed the local node and performance even improves including reads from the capacity (SAS/SATA) tier.

Storage only nodes were previously limited to the NX-6035C (and Dell XC/Lenovo HX equivalents) but at Nutanix .NEXT conference in Las Vegas 2016, it was announced that any node (including all-flash) can be a storage only node.

This means even for high performance and/or high capacity environments, Nutanix clusters can be scaled without the need to add compute node or purchase additional licensing if you are running vSphere as the hypervisor.

However to date Nutanix are yet to publish any performance data showing the value of storage only nodes, so I decided to run a few tests and demonstrate the value of the Acropolis Distributed Storage Fabric (ADSF) and Storage Only Nodes.

Before we get to the performance data, to avoid competitors inevitable attempts to create FUD about Nutanix performance, I will not be publishing the exact specifications of the node types, drive or Jetstress configurations. I will be publishing the IOPS/latency and database creation, duplication and checksumming durations of the direct comparisons which clearly show the performance advantage of storage only nodes.

Jetstress was not configured to demonstrate maximum performance of the underlying Nutanix solution, it was configured to achieve around 1000 IOPS which is typically higher than even a large Exchange deployment requires per instance. This also allows this test to demonstrate how performance improves when the cluster is performing real world levels of IO (at least in the case of Exchange for this example).

The performance advantage will vary between node types and based on how many storage only nodes are added to the cluster. But the point of this example is to show that ADSF is a truely distributed storage fabric and the storage only nodes and additional Nutanix Controller VMs (CVMs) servicing replication (RF) traffic and remote reads significantly improves performance for VMs residing on the Compute+Storage nodes.

Test Overview:

The first test will be performed using four Jetstress VMs running on a four node cluster. The second test will be performed after an additional four storage only nodes are added to the cluster to form an eight node cluster. Before the second test the cluster will be wiped of all data with the exception of the Windows 2012 R2 template and all Jetstress DBs will be created from scratch so we can compare DB creation as well as performance and DB checksumming durations. Wiping all data also ensures there is no pre-warming of the extent cache (in memory read cache) or metadata cache.

Test Preparation:

I performed a cluster stop / cluster destroy / cluster create to ensure the cluster is totally clean and that we have a fair baseline for the test. The cluster was made up of four nodes.

I then created a base Windows 2012 R2 virtual machine with 4 PVSCSI adapters and 9 vDisks, one for the OS, 4 for the DBs and 4 for the logs. DB drives were formatted with 64k allocation size and log drives with 4k as the different allocation size and seperate virtual disks has shown approx 25% performance improvement in my testing not to mention I recommend In-Line compression and Erasure Coding (EC-X) for Exchange databases and no data reduction for logs.

Jetstress was configured to use 80% of the vDisks capacity which resulted in approx 80% of the Nutanix storage pool capacity being utilised for the test. I will point out these were not low capacity nodes such as NX3060s so the database creation time is significant because there was lots of data to create.

I then cloned the VM 3 times and spread the 4 VMs across 4 Nutanix Nodes running ESXi 5.5 Update 3.

Test 1: Create Databases and run 2hr test

The databases creation phase creates one database, then Jetstress duplicates the database in this case 3 times and immediately after creation the performance test begins.

Note: No data reduction was used for this test as it will result in unrealistic data reduction and performance results as I described in the post Jetstress Testing with Intelligent Tiered Storage Platforms.

I configured Jetstress in this way to ensure the extent cache (in memory read cache) was not pre-warmed and so the results of the test would be fair and repeatable.

Once the performance test completed, I waited for each test to complete before allowing the database checksum validation task to complete. (This is done by using the Multi-host option in Jetstress).

The results for each of the four Jetstress VMs are shown below including the average across the VMs for each of the difference metrics.

Jetstress4NodesSummary

Observations from Test 1:

  1. We achieved the desired >1000 IOPS per VM
  2. Performance was consistent across all Jetstress instances
  3. Log writes were in the 1ms range as they were serviced by the ADSF Oplog (persistent write buffer)
  4. Database reads were on average just under 10ms which is well below the Microsoft recommended 20ms
  5. The Database creation time averaged 2hrs 24mins
  6. The duplication of 3 databases averaged 4hrs 17mins
  7. The database checksum took on average around 38mins

Test 2: Delete all data, Add four nodes to the cluster & repeat test 1

All Jetstress VMs were deleted and a full curator scan manually initiated to ensure all data was fully removed from disk prior to beginning the next test which ensured a fair baseline.

Four Jetstress VMs were then deployed from the same template, powered on and the saved Jetstress configuration was applied before beginning the test.

Note: The Jetstress thread count was not changed and remains the same as for Test 1.

As with Test 1 the databases creation phase created one database, then Jetstress duplicates the database 3 times and immediately after creation the performance test begins and ran for the same 2hr duration.

The results for each of the four Jetstress VMs are shown below including the average across the VMs for each of the difference metrics.

Jetstress8NodesSummary

Observations from Test 2:

  1. Achieved IOPS jumped by almost 2x
  2. Log writes average latency was lower by 13%
  3. Database write latency dropped by >20%
  4. Database read latency dropped by almost 2x
  5. The Database creation time was just under 15 mins faster
  6. The duplication of 3 databases improved by almost 35 mins
  7. The database checksum was 40 seconds faster.

Without changing the Jetstress thread count, due to the improved performance of the cluster the achieved IOPS jumped by 2x!!

Summary:

These tests is a clear demonstration of the scalability advantage of the Acropolis Distributed Storage Fabric (ADSF) and storage only nodes for customers wanting to increase performance and/or capacity in their HCI environment.

The ability of ADSF to distribute write IO across all nodes within a cluster means write performance improves significantly with the addition of nodes (including storage only) to the cluster while reducing read and write latency due to the decreased workload on the compute + storage nodes servicing the VMs.

But data locality is lost with storage only nodes, right?

Wrong! Storage only nodes actually improve (yes, improve!) data locality by maximising the amount of available space on the compute+storage nodes. This is as a direct result of storage only nodes accepting replication data for write IO and storing the 2nd or 3rd copies (in the case of RF3) on the storage only nodes. This is also demonstrated by the lower read latency observed during this test.

Storage only nodes not only improve the performance and capacity for Virtual machines, but also for physical servers using Acropolis Block Services (ABS) and users of Acropolis File Services (AFS) both of which had enhancements announced at .NEXT 2016 this year.

Storage Performance : ReFS vs NTFS

I am regularly asked by customers if they should use NTFS or the newer ReFS when formatting drives for applications like Microsoft Exchange and SQL.

Most customers are asking in the context of performance, so I thought I would share some recent testing results using MS Exchange Jetstress.

Firstly, what is ReFS and when/would you use ReFS?

What is ReFS?

Resilient File System (ReFS) is a new local file system. It maximizes data availability, despite errors that would historically cause data loss or downtime. Data integrity ensures that business critical data is protected from errors and available when needed. Its architecture is designed to provide scalability and performance in an era of constantly growing data set sizes and dynamic workloads.

The key features of ReFS are:

  • Integrity: ReFS stores data so that it is protected from many of the common errors that can cause data loss. File system metadata is always protected. Optionally, user data can be protected on a per-volume, per-directory, or per-file basis. If corruption occurs, ReFS can detect and, when configured with Storage Spaces, automatically correct the corruption. In the event of a system error, ReFS is designed to recover from that error rapidly, with no loss of user data.
  • Availability: ReFS is designed to prioritize the availability of data. With ReFS, if corruption occurs, and it cannot be repaired automatically, the online salvage process is localized to the area of corruption, requiring no volume down-time. In short, if corruption occurs, ReFS will stay online.
  • Scalability: ReFS is designed for the data set sizes of today and the data set sizes of tomorrow; it’s optimized for high scalability.
  • App Compatibility: To maximize AppCompat, ReFS supports a subset of NTFS features plus Win32 APIs that are widely adopted.
  • Proactive Error Identification: The integrity capabilities of ReFS are leveraged by a data integrity scanner (a “scrubber”) that periodically scans the volume, attempts to identify latent corruption, and then proactively triggers a repair of that corrupt data.

Source: Microsoft Technet – Resilient file system

From my perspective, ReFS makes sense when using physical servers with unintelligent storage such as JBOD or any storage which does not perform things such as checksums on both read and write IO and enforce Force Unit Access (FUA). However if you’re deploying MS Exchange / MS SQL etc on intelligent storage such as Nutanix Acropolis Distributed Storage Fabric (ADSF) then ReFS is not required as data integrity is already ensured by the storage layer. For example, in the event of silent data corruption, ADSF will detect the corruption on read and simply retrieve the data from the second copy which resides on a different physical drive on a different node within the cluster. This is also transparent to the Virtual Machine, OS and application and therefore compatible with any OS and application.

As a result ReFS (at least in its current version) is not required for deployments of Microsoft OS,Apps on Nutanix or other storage solutions if they have the same functionality.

None the less, this is not supposed to be a post about Nutanix, so let’s now look at the test bed and results of the performance comparison so you can make an informed decision about which to use

Test Bed Setup

The test bed setup is as follows:

Hypervisor: ESXi 5.5 Rel: 3248547

2 Virtual Machines cloned from the same template:
Windows 2012 R2 , 4 vCPUs , 24Gb RAM
4 Paravirtual SCSI adapters
1 vDisk for OS , 4 vDisks for DB, 4 vDisks for Logs

Both VMs are running on the same node, with only one VM running Jetstress at a time. All tests runs were back to back to ensure results would be fair and to check the consistency of the results.

The only difference between the two VMs is as follows:

VM1:

4 vDisks formatted with NTFS and 64k allocation size for Database
4 vDisks formatted with NTFS and 4k allocation size for Logs

VM2:

All 8 vDisks formatted with ReFS (64k)

Tests performed:

Three Jetstress runs per VM one after another, importantly with new databases created before each run to ensure a fair baseline. Doing this ensured the results were skewed by having the Extent Cache (In-Memory Read Cache) or the Medusa Cache (In-Memory Metadata Cache) pre-warmed.

Each run used 16 threads and resulted in the following results.

ReFS Jetstress Instance:

Run One: 6697 IOPS
Run Two: 6896 IOPS
Run Three: 6796 IOPS

Average: 6796 IOPS (approx +-3% between runs)

NTFS Jetstress Instance:

Run One: 7328 IOPS
Run Two: 7240 IOPS
Run Three: 7296 IOPS

Average: 7288 IOPS (approx +-1% between runs)

Result:

The difference being approx 7% higher performance and more consistency when using NTFS.

Additional Tests:

Out of interest I repeated the tests with a lower thread count (8) to see if the results were consistent as we decreased the threads.

8 Threads:

ReFS: 3921 IOPS
NTFS: 4079 IOPS

The result again went in favour of NTFS by approx 4%. This makes sense as the advantage would diminish as the pressure on the storage layer reduces.

Autotune Result:

I then repeated the test with Jetstress set to Autotune with the following results.

ReFS: 16673 IOPS @ 91 threads (Autotuned)
NTFS: 17758 IOPS @ 96 threads (Autotuned)

The autotune results again show that NTFS has an advantage over ReFS of approx 7% which is in line with the results using 16 threads manually configured.

CPU overheads comparisons

ReFS Jetstress Instance:

Run One:Avg 39.293% (Min 23.725 / Max 44.127)
Run Two:Avg 40.28% (Min 37.785 / Max 44.366)
Run Three: Avg 40.175% (Min 36.520 / Max 43.843)

Average: 39.916%

NTFS Jetstress Instance:

Run One: Avg 39.390% (Min 36.746 / Max 42.651)
Run Two: Avg 39.719% (Min 23.613 / Max 45.960)
Run Three:Avg 39.844% (Min 37.347 / Max 42.400)

Average: 39.651%

So NTFS achieved 7% better performance than ReFS using the same thread count even with the Data Integrity features turned off for ReFS volumes without using any more CPU.

Summary:

Overall these tests demonstrate that NTFS consistently outperforms ReFS for MS Exchange type IO patterns. For intelligent storage, ReFS has no advantages and NTFS will provide better performance with roughly the same CPU overheads and without any risk of data integrity issues.

As the recommendation for ReFS is to disable the data integrity features for Exchange, I am yet to hear a good justification as to why ReFS is recommended, but I welcome any comments from those in the know and if the justifications are solid I will update the post to reflect these reasons.

Related Articles:

1. Jetstress Testing with Intelligent Tiered Storage Platforms

2. MS Exchange on Nutanix Acropolis Hypervisor (AHV)

3. How to successfully Virtualize MS Exchange

4. Deduplication and MS Exchange