In helping to prepare this TCO with Steve Kaplan here at Nutanix, I’ll be honest and say I was a little surprised at the results.
The Nutanix Enterprise Cloud platform is the leading solution in the HCI space and it while it is aimed to deliver great business outcomes and minimise CAPEX,OPEX and TCO, the platform is not designed to be “cheap”.
Nutanix is more like the top of the range model from a car manufacturer with different customer requirements. Nutanix has options ranging from high end business critical application deployments to lower end products for ROBO, such as Nutanix Xpress model.
Steve and I agreed that our TCO report needed to give the benefit of the doubt to Pure Storage as we do not claim to be experts in their specific storage technology. We also decided that as experts in Nutanix Enterprise Cloud platform and employees of Nutanix, that we should minimize the potential for our biases towards Nutanix to come into play.
The way we tried to achieve the most unbiased view possible is to give no benefit of the doubt to the Nutanix Enterprise Cloud solution. While we both know the value that many of the Nutanix capabilities have (such as data reduction), we excluded these benefits and used configurations which could be argued at excessive/unnecessary such as vSphere or RF3 for data protection:
- No data reduction is assumed (Compression or Deduplication)
- No advantage for data locality in terms of reduced networking requirements or increased performance
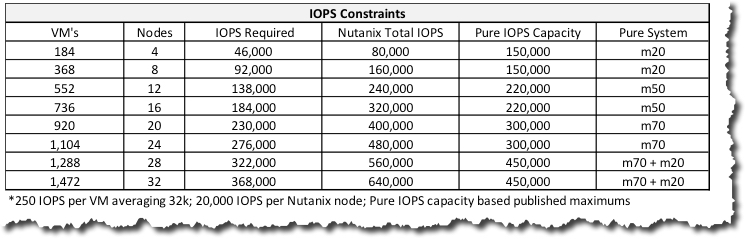
- Only 20K IOPS @ 32K IO Size per All Flash Node
- Resiliency Factor 3 (RF3) for dual parity data protection which is the least capacity efficient configuration and therefore more hardware requirements.
- No Erasure Coding (EC-X) meaning higher overheads for data protection.
- The CVM is measured as an overhead with no performance advantage assumed (e.g.: Lower latency, Higher CPU efficiency from low latency, Data Locality etc)
- Using vSphere which means Nutanix cannot take advantage of AHV Turbo Mode for higher performance & lower overheads
On the other hand, the benefit of the doubt has been given to Pure Storage at every opportunity in this comparison including the following:
- 4:1 data reduction efficiency as claimed
- Only 2 x 10GB NICs required for VM and Storage traffic
- No dedicated FC switches or cables (same as Nutanix)
- 100% of claimed performance (IOPS capability) for M20,M50 and M70 models
- Zero cost for the project/change control/hands on work to swap Controllers as the solution scales
- IOPS based on the Pure Storage claimed average I/O size of 32K for all IO calculations
We invited DeepStorage and Vaughn Stewart of Pure Storage to discuss the TCO and help validate our assumptions, pricing, sizing and other details. Both parties declined.
Feedback/corrections regarding the Pure Storage sponsored Technical Report by DeepStorage was sent via Email, DeepStorage declined to discuss the issues and the report remains online with many factual errors and an array (pun intended) of misleading statements which I covered in detail in my Response to: DeepStorage.net Exploring the true cost of Converged vs Hyperconverged Infrastructure
It’s important to note that the Nutanix TCO report is based on the node configuration chosen by DeepStorage with only one difference: Nutanix sized for the same usable capacity, but went with an All Flash solution because comparing hybrid and all flash is apples and oranges and a pointless comparison.
With that said, the configuration DeepStorage chose does not reflect an optimally designed Nutanix solution. An optimally designed solution would likely result in fewer nodes by using 14c or 18c processors to match the high RAM configuration (512GB) and different (lower) capacity SSDs (such as 1.2TB or 1.6TB) which would deliver the same performance and still meet the capacity requirements which would result in a further advantage in both CAPEX, OPEX and TCO (Total Cost of Ownership).
The TCO shows that the CAPEX is typically in the favour of the Nutanix all flash solution. We have chosen to show the costs at different stages in scaling from 4 to 32 nodes – the same as the DeepStorage report. The FlashStack product had slightly lower CAPEX on a few occasions which is not surprising and also not something we tried to hide to make Nutanix always look cheaper.
One thing which was somewhat surprising is that even with the top of the range Pure M70 controllers and a relatively low IO per VM assumption of 250, above 24 nodes the Pure system could not support the required IOPS and an additional M20 needed to be added to the solution. What was not surprising is in the event an additional pair of controllers and SSD is added to the FlashStack solution, that the Nutanix solution had vastly lower CAPEX/OPEX and of course TCO. However, I wanted to show what the figures looked like if we assume IOPS was not a constraint for Pure FlashStack as could be the case in some customer environments as customer requirements vary.
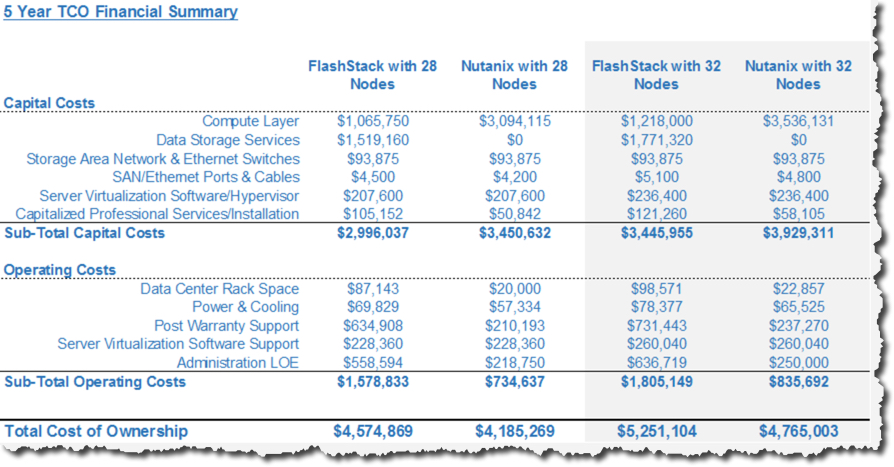
What we see above is the difference in CAPEX is still just 14.0863% at 28 nodes and 13.1272% difference at 32 nodes in favor of Pure FlashStack.
The TCO, however, is still in favor of Nutanix at 28 nodes by 8.88229% and 9.70447% difference at 32 nodes.
If we talk about the system performance capabilities, the Nutanix platform is never constrained by IOPS due to the scale out architecture.
Based on Pure Storage advertised performance and a conservative 20K IOPS (@ 32K) per Nutanix node, we see (below) that Nutanix IO capability is always ahead of Pure FlashStack, with the exception of a 4 node solution based on our conservative IO assumptions. In the real world, even if Nutanix was only capable of 20K IOPS per node, the platform vastly exceeds the requirements in this example (and in my experience, in real world solutions) even at 4 node scale.
I’ve learned a lot, as well as re-validated some things I’ve previously discovered, from the exercise of contributing to this Total Cost of Ownership (TCO) analysis.
Some of the key conclusions are:
- In many real world scenarios, data reduction is not required to achieve a lower TCO than a competing product which leverages data reduction.
- Even the latest/greatest dual controller SANs still suffer the same problems of legacy storage when it comes to scaling to support capacity/IO requirements
- The ability to scale without rip/replace storage controllers greatly simplifies customers sizing
- Nutanix has a strong advantage in Power, Cooling, Rack Space and therefore helps avoid additional datacenter related costs.
- Even the top of the range All Flash array from arguably the top vendor in the market (Pure Storage) cannot match the performance (IOPS or throughput) of Nutanix.
The final point I would like to make is the biggest factor which dictates the cost of any platform, be it the CAPEX, OPEX or TCO is the requirements, constraints, risks and assumptions. Without these, and a detailed TCO any discussion of cost has no basis and should be disregarded.
In our TCO, we have detailed the requirements, which are in line with the DeepStorage report but go further to make a solution have context. The Nutanix TCO report covers the high level requirements and assumptions in the Use Case Descriptions.
Without further ado, here is the link to the Total Cost of Ownership comparison between Pure FlashStack and Nutanix Enterprise Cloud platform along with the analysis by Steve Kaplan.