Having worked at Nutanix since mid 2013 with a focus on business critical applications, scalability, resiliency and performance, I’m frequently having conversations with customers and partners around resiliency and how best to configure the Nutanix platform.
One of the many strengths of the Nutanix platform, and an area I spend a lot of my time and energy is it’s resiliency and data integrity and it’s important to understand failure scenarios and how a platform deals with them.
Nutanix uses it’s own distributed storage fabric (ADSF) to provide storage to virtual machines, containers & even physical servers which can be configured with Resiliency Factor (RF) 2 or 3, meaning two or three copies of the data is stored for resiliency and performance.
From an oversimplified view, it is easy to compare RF2 with N+1 e.g.: RAID 5 and RF3 with N+2 e.g.: RAID 6, however in reality RF2 and 3 are vastly more resilient than traditional RAID due to the distributed storage fabrics ability to rebuild from failure extremely quickly and proactive disk scrubbing to detect and resolve issues before they result in failures.
Nutanix performs checksums on every read and write as well as performs continual background scrubbing to ensure maximum data integrity. This ensures than things like Latent Sector Errors (LSEs) and Bit rot, and normal drive wear & tear is proactively detected and addressed.
A critical factor when discussing the resiliency of ADSF even when used with RF2 is the speed at which compliance with RF2 or RF3 can be restored in the event of a drive or node failure.
Because the rebuild is a fully distributed operation across all nodes and drives (i.e.: A Many to many operation), it’s both very fast and the workload per node is minimised to avoid bottlenecks and to reduce the impact to running workload.
How fast is fast? Well, of course it depends on many factors including the size of the cluster, the number/type of drives (e.g.: NVMe, SATA-SSD, DAS-SATA) as well as the CPU generation and network connectivity, but with this in mind I thought I would give an example.
The test bed is a 16 node cluster with a mix of almost 5 year old hardware including NX-6050 and NX-3050 nodes using Ivy Bridge 2560 Processors (Launched Q3, 2013), each with 6 x SATA-SSDs ranging in size and 2 x 10GB network connectivity.
For this test, no data reduction technologies (Deduplication, Compression or Erasure Coding) were in use as these would skew the performance of the rebuild depending on the data reduction achieved. The results in this test case are therefore not the best case scenario as data reduction can and does improve performance and would reduce the amount of data needing to be re-protected by the data reduction ratio.
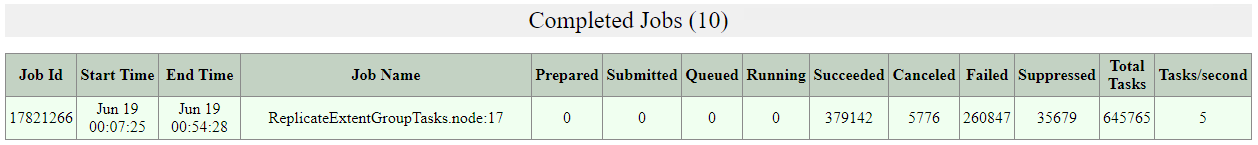
As shown below, the nodes have a little over 5TB of data in use so the speed we’re measuring today is the performance of 5TB rebuild from a simulated node failure. Half the nodes in the cluster have approx 9TB capacity and the other half have between 3TB and 1.4TB capacity.

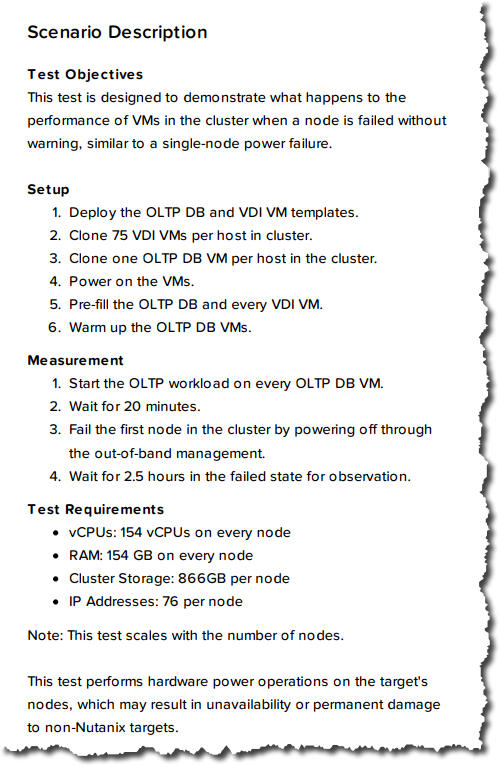
The node failure is simulated by using the IPMI interface and using the “Power off server – immediate” option as shown below. This is the equivalent of pulling the power out of the back of a physical server.

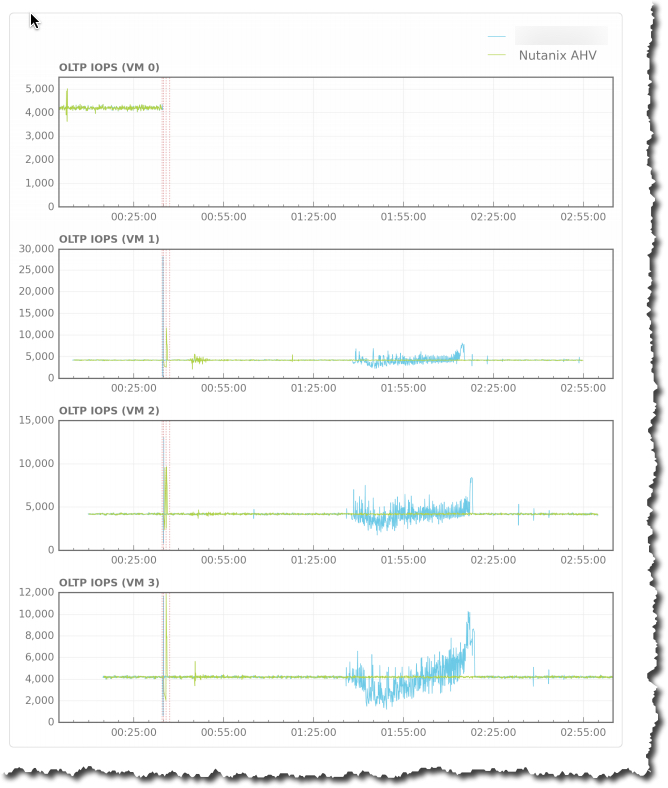
The resiliency advantage of the Acropolis Distributed Storage Fabric (ADSF) is obvious when you look at the per node statistics during a node failure. We can see that well over 1GBps of throughput is driven by a single node and all nodes within the cluster are contributing roughly equal throughput based on their capacity.

The reason for half the nodes throughput being lower is they have much lower capacity and therefore have less data (replicas) to provide to the rebuild. If all nodes were the same capacity, the throughput would be roughly even as shown by the first four nodes in the list.
If Nutanix did not have a distributed storage fabric, rebuilds would be constrained by the source and/or the destination node much like RAID or more basic HCI platforms e.g.: Node A replicas a large object to Node B as opposed to all nodes replicating small extents (1MB) across the entire cluster in an efficient Many to Many process.
In comparison with a traditional RAID5, the source for the rebuild is only the drives in the specific RAID where the failure occurred. RAID sets are typically between 3 and say 24 at the upper end of the spectrum, and the destination for a rebuild is a single “hot spare” or replacement drive, meaning the rebuild operation is bottlenecked by a single drive.
Almost every I.T professional has a horror story or five about data loss from RAID 5 and even RAID 6 due to subsequent failures during the extended periods of time (usually measured in hours and days) it took these RAID packs to recover from a single drive failure.
The larger the drives in the RAID pack, the longer the rebuild and the higher the risk of data loss from subsequent failures. The performance impact during RAID rebuilds is also very high due to only a subset of drives being the source and typically only one drive being the destination. This means long windows of performance impact and unprotected data.
These common bad experiences are in my opinion are a major reason why N+1 (and even RF2) is given a bad name. If RAID 5 and 6 could have rebuild from a drive failure in minutes, the vast majority of subsequent failures would likely not have resulted in downtime or data loss.
Now back to the rebuild performance of Nutanix ADSF.
Again because ADSF distributes replicas (data) throughout the cluster at 1MB granularity (as opposed to a “pair” style configuration where all data is on only 2 nodes) it allows the platform to improve write performance (as more controllers service the I/O) and during rebuilds, more controllers, CPUs, network bandwidth is available to service the rebuild.
In short, the larger the cluster, the more nodes read and write replicas and the faster the recovery can perform. The impact of a failure and rebuild is reduced the larger the cluster is, meaning larger clusters can provide excellent resiliency even with RF2.
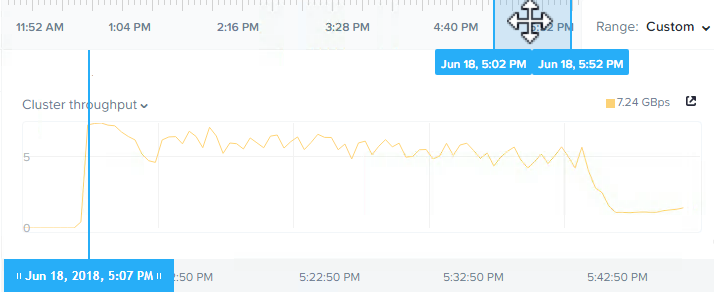
Below is a screenshot from the Analysis tab in Nutanix HTML 5 PRISM GUI. It shows the storage pool throughput during the rebuild from the simulated node failure.

As we can see, the chart shows the rebuild starts after 8.26PM and completes before 8:46PM and sustains around 9GBps throughput until completion.
So in this example, in the event of a 5 year old node with >5TB capacity usage, full data integrity is restored in less than 20 mins.
As the cluster size increases, or if newer node types were used with faster processors, NICs and storage such as NVMe drives, the rebuild would have performed significantly faster but even this shows that the risk of subsequent failures causing data loss when using RF2 (2 copies of data) is limited to a very short window.
Summary:
- Nutanix RF2 is vastly more resilient than RAID5 (or N+1) style architectures
- ADSF performs continual disk scrubbing to detect and resolve underlying issues before they can cause data integrity issues
- Rebuilds from drive or node failures are an efficient distributed operation using all drives and nodes in a cluster
- A recovery from a >5TB node failure (in this case, the equivalent of 6 concurrent SSD failures) can be less than 20mins
Next let’s discuss how to convert from RF2 to RF3 and how fast this compliance task can complete.
Index:
Part 1 – Node failure rebuild performance
Part 2 – Converting from RF2 to RF3
Part 3 – Node failure rebuild performance with RF3
Part 4 – Converting RF3 to Erasure Coding (EC-X)
Part 5 – Read I/O during CVM maintenance or failures
Part 6 – Write I/O during CVM maintenance or failures
Part 7 – Read & Write I/O during Hypervisor upgrades
Part 8 – Node failure rebuild performance with RF3 & Erasure Coding (EC-X)
Part 9 – Self healing
Part 10: Nutanix Resiliency – Part 10 – Disk Scrubbing / Checksums